


Why This Matters to Distributors: Fastenal’s results show how larger customer accounts and automated inventory services can increase sales without a comparable rise in staffing. Those accounts carry lower gross margins, but Fastenal more than offset that pressure by spreading operating expenses across a larger revenue base.
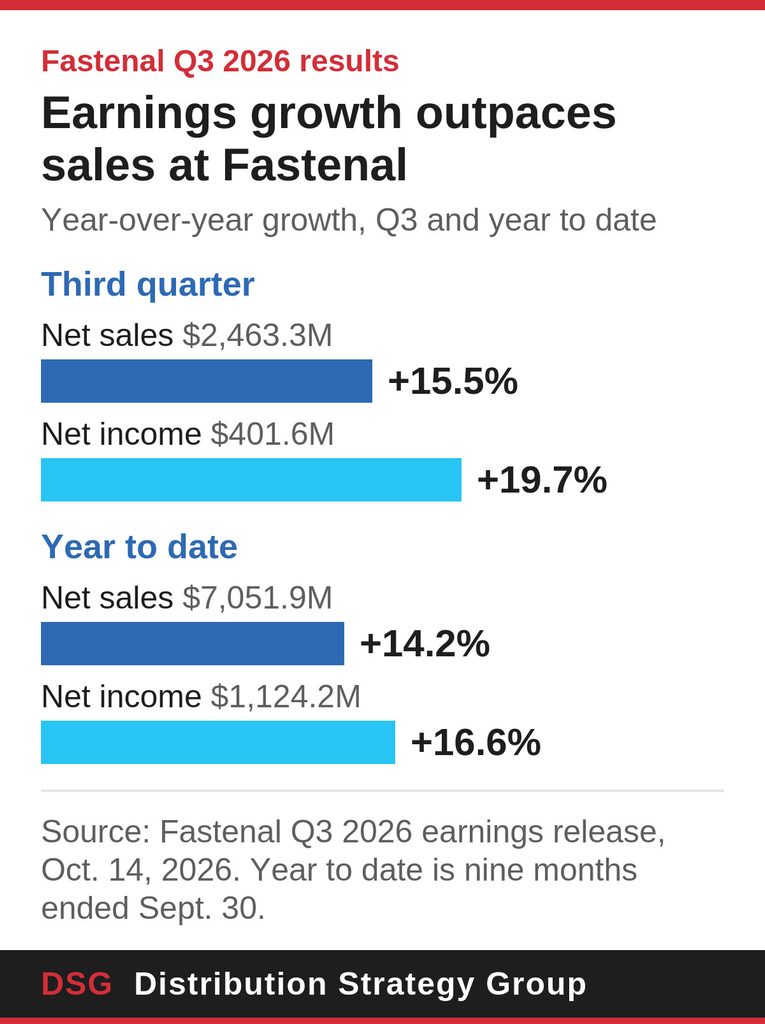
Fastenal’s push to capture more business from large industrial customers lifted third-quarter sales 15.5% and profit 19.7%, as the distributor handled higher volume with only a modest increase in staffing.
Sales reached $2.46 billion for the quarter ending Sept. 30, up from $2.13 billion a year earlier. Net income increased to $401.6 million from $335.5 million.
The results extended a year of double-digit growth. For the first nine months, Fastenal’s sales increased 14.2% to $7.05 billion from $6.17 billion. Net income rose 16.6% to $1.12 billion from $964.4 million.
Fastenal attributed the quarter’s performance to new contracts, increased spending by major accounts, improving unit volumes and stronger industrial demand. Pricing contributed about 2.4 percentage points to sales growth, although its contribution was slowing as Fastenal began comparing results against price increases implemented in 2025.
The clearest evidence of the company’s changing customer base came from locations spending at least $50,000 a month. Sales to those sites increased 27.6% to $1.46 billion from $1.14 billion, accounting for about 59% of quarterly revenue, up from approximately 54% a year earlier.
Fastenal served an average of 3,288 locations a month in that spending category, an 18.7% increase from 2,771. Average monthly sales per location rose 7.5% to $147,668. Its contract count increased 6.4% to 3,744, with signings weighted toward national customers operating multiple locations.
Growth among those accounts contrasted with a decline in the overall number of customer locations Fastenal served. Its average monthly active site count fell 8.2% to 90,759 from 98,823, while average monthly sales per site increased 26.5% to $9,047.
The figures show a business increasingly concentrated in higher-spending customer locations. They also help explain how Fastenal increased revenue substantially faster than its employee count.
Fastenal ended the quarter with 24,679 employees, up 1% from a year earlier. Selling personnel declined 0.5% to 17,117, while distribution and transportation staffing increased 3.6% to 4,129. Manufacturing and organizational support staffing also increased.
That gap between sales growth and staffing growth helped lift operating income 20.2% to $530.8 million from $441.5 million. Selling, general and administrative expenses rose 9.4% to $573.9 million, substantially below revenue growth, and fell to 23.3% of sales from 24.6%.
Larger customers were the principal source of that gross margin pressure. Fastenal said those accounts carry lower gross margins but allow it to spread service and operating costs across more revenue. Customer mix reduced quarterly gross margin by approximately half a percentage point.
Gross profit increased 14.4% to $1.10 billion from $965.8 million. Gross margin was 44.8%, with Fastenal reporting a decline of approximately 0.4 percentage points using unrounded figures.
The same pattern held through the first nine months: expenses grew more slowly than sales, allowing operating profit to rise despite lower gross margins. Year-to-date operating income increased 16.4% to $1.48 billion, and operating margin reached 21%, compared with 20.6% a year earlier.
Manufacturing customers remained the foundation of Fastenal’s growth. Quarterly sales to those customers increased 17% to $1.89 billion from $1.61 billion, while non-manufacturing sales rose 10.6% to $578.2 million.
Heavy manufacturing led the company’s end markets, with daily sales increasing 20.2% year over year. The category accounted for 44.6% of quarterly revenue, supported by major accounts and customers in machined products, aerospace and industrial equipment.
Daily sales to other manufacturing customers increased 13.2%, while sales to other end markets rose 12.3%. Fastenal also cited contributions from construction, transportation and resellers.
Through September, daily sales growth reached 17.6% in heavy manufacturing, 11.3% in other manufacturing and 13.5% in other end markets.
Products used directly in customers’ finished goods grew faster than supplies used to maintain their operations. Daily sales of direct materials increased 18.6%, compared with 14.3% for indirect materials. Electrical products, welding and abrasives, tools, hydraulics and pneumatics, cutting tools, and material handling products grew faster than the company overall.
Fastenal’s inventory services continued to expand alongside those customer relationships. Its installed base of Fastenal Managed Inventory devices reached 143,878, and signings averaged 117 devices per business day, up 6.4% from 110 a year earlier. Sales through FASTBin and FASTVend grew faster than total company sales.
The systems place inventory near where customers use it and automate replenishment. Fastenal said technology reduces manual service work while giving it opportunities to supply a larger share of customers’ purchases.
Electronic business daily sales increased 14.8%, accelerating from 8% growth in the prior-year quarter. However, electronic business accounted for 28.8% of revenue, down from 29.1%, as other parts of the business grew faster.
Fastenal’s broader digital footprint represented 61.4% of sales. The company now expects that measure to account for 62% to 63% of full-year revenue, below its original estimate of 66%. It continues to expect 27,000 to 29,000 inventory device signings this year, compared with an original estimate of 28,000 to 30,000.
Cash generation increased more slowly than earnings. Third-quarter operating cash flow rose 9% to $421.6 million from $386.9 million, while free cash flow increased 5.3% to $349.6 million from $332.1 million.
Operating cash flow equaled 105% of net income, compared with 115.3% a year earlier. Free cash flow, a company-defined measure of cash remaining after specified investments, equaled 87.1% of net income, down from 99%.
Through September, Fastenal generated $1.07 billion in operating cash flow and $873.6 million in free cash flow. Those amounts represented 94.8% and 77.7% of net income, respectively.
The company also increased investment in its operations. Third-quarter spending on property and equipment, after proceeds from asset sales, rose 31.3% to $71.8 million from $54.7 million. Net spending through the first nine months totaled $190 million.
Do not miss any content from Distribution Strategy Group. Join our list.
Share this article:
