



Why This Matters to Distributors: Canadian wholesale sales increased in July, but sales volume fell after accounting for price changes. A preliminary August estimate points to a further slowdown. The next report will show how demand and inventories changed across distribution markets, including building products, industrial equipment, food, and health care supplies.
Canadian wholesale sales are expected to have declined 1.5% in August, following modest July growth that masked weaker sales volume and uneven results across distribution markets.
Statistics Canada is scheduled to release its full August wholesale trade report Oct. 15. Its preliminary estimate points to lower sales primarily in agricultural supplies and motor vehicles, parts, and accessories.
The latest full monthly report showed July wholesale sales of CA$93.1 billion (US$65.46 billion), up 0.3% from June and 7.9% from July 2025. After adjusting for prices, however, sales volume declined 0.6% from June, indicating that revenue growth did not reflect an increase in the volume of goods sold.
Building materials and supplies led July’s monthly gains. Sales reached CA$13.8 billion (US$9.70 billion), up 3.5% from June and 14.3% from a year earlier. Electrical, plumbing, heating and air conditioning equipment and supplies sales increased 0.6% monthly and 14.7% annually to CA$4.8 billion (US$3.38 billion).
Metal service center sales rose 10.3% from June to CA$2.6 billion (US$1.83 billion), partly because of higher steel prices. Food, beverage, and tobacco sales increased 1.7% to CA$16.7 billion (US$11.74 billion), with higher food volumes contributing to the gain.
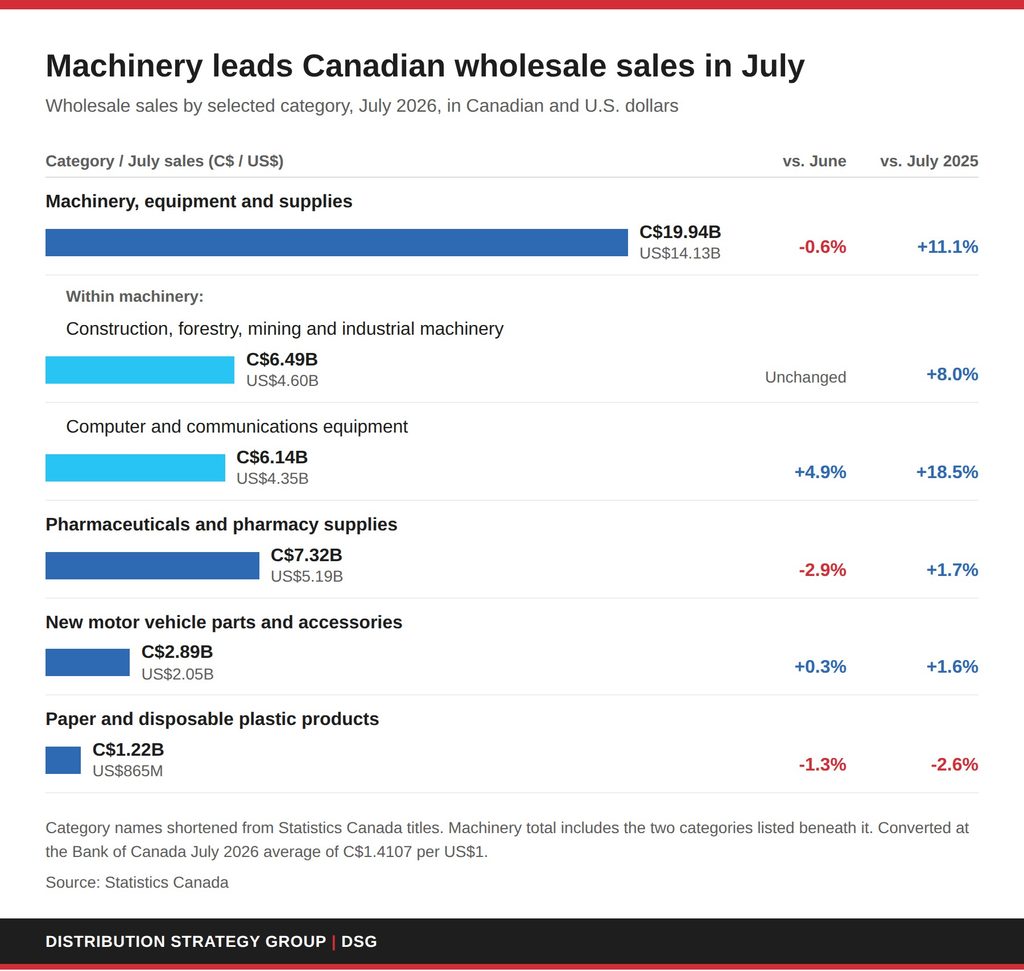
Machinery, equipment, and supplies sales declined 0.6% from June to CA$19.94 billion (US$14.02 billion) but remained 11.1% above July 2025. Within that category, construction, forestry, mining and industrial machinery, equipment and supplies sales were unchanged monthly at CA$6.49 billion (US$4.56 billion), up 8% from a year earlier. Computer and communications equipment and supplies sales rose 4.9% monthly and 18.5% annually to CA$6.14 billion (US$4.32 billion).
Pharmaceuticals and pharmacy supplies sales fell 2.9% from June to CA$7.32 billion (US$5.15 billion), although they remained 1.7% above a year earlier. New motor vehicle parts and accessories sales increased 0.3% monthly and 1.6% annually to CA$2.89 billion (US$2.03 billion).
Paper, paper products, and disposable plastic products posted declines in both comparisons. Sales totaled CA$1.22 billion (US$860 million), down 1.3% from June and 2.6% from July 2025.
Wholesale inventories were unchanged from June at CA$140.6 billion (US$98.86 billion) but remained 5.5% above July 2025. Food, beverage, and tobacco inventories declined 0.9% monthly to CA$16 billion (US$11.25 billion), while personal and household goods inventories fell 1.7% to CA$22.5 billion (US$15.82 billion). Both remained above year-earlier levels.
The inventory-to-sales ratio edged down to 1.51 from 1.52 in June. The ratio measures how many months it would take to exhaust inventories at the current sales pace. August’s figures will help establish whether stock levels adjusted alongside the expected sales decline.
Regional results also diverged. Ontario’s July sales increased 1% to CA$48.7 billion (US$34.24 billion), and British Columbia’s rose 4.9% to CA$9 billion (US$6.33 billion). Quebec’s declined 2.8% to CA$15.7 billion (US$11.04 billion), while Alberta’s fell 1% to CA$10.3 billion (US$7.24 billion).
The projected August pullback follows a stronger second quarter, when wholesale sales totaled CA$272.8 billion (US$191.82 billion). Sales increased 4.2% from the first quarter and 7.9% from a year earlier, while volume rose 2.8% from the first quarter.
The August advance estimate remains subject to revision. Statistics Canada based it on a weighted response rate of 68.6%, compared with an average final response rate of 83.7% over the preceding 12 months. The agency cautions that advance estimates are more susceptible to revision than regular monthly results.
All figures are seasonally adjusted and exclude petroleum, petroleum products, and other hydrocarbons, as well as oilseed and grain. Sales are measured in current dollars unless identified as volume figures.
Do not miss any content from Distribution Strategy Group. Join our list.
Share this article:
