



Why This Matters to Distributors: Rising freight and product prices continued to pressure distribution costs in October, even as monthly inflation slowed. Wholesale margin measures varied by sector, highlighting differences in distributors’ ability to recover higher costs through selling prices.
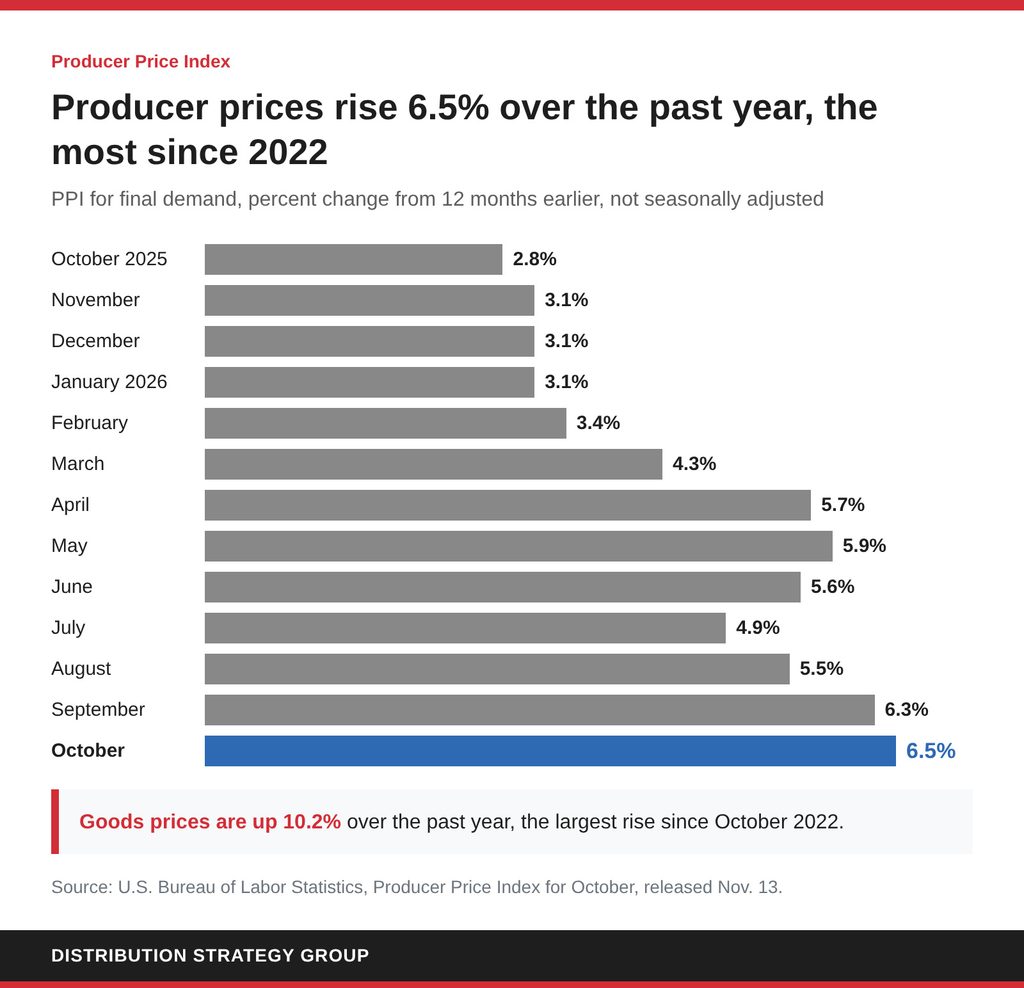
U.S. wholesale prices rose 6.5% in October from a year earlier, the largest annual increase in four years, as higher goods prices and freight charges sustained pressure on business costs.
The Producer Price Index for final demand increased a seasonally adjusted 0.3% from September, following gains of 1.4% in September and 0.4% in August, the Bureau of Labor Statistics reported Nov. 13. The annual increase was the largest since November 2022.
The report showed uneven conditions across distribution markets. Truck freight prices climbed sharply, while the broad measure of wholesale and retail trade margins declined. Prices increased for food, chemicals, and several industrial inputs, even as diesel fuel and some raw materials became less expensive.
Transportation and warehousing prices rose 2% in October, accounting for three quarters of the monthly increase in final-demand service prices. Truck freight prices increased 3.9%, accounting for more than 80% of the overall services increase.
The increase in freight came as producer prices for diesel fuel fell 7.9%. Lower diesel prices therefore did not coincide with a decline in the report’s measure of trucking charges during the month.
Final-demand goods prices increased 0.5%, slowing down from September’s 2.5% gain. Goods prices nevertheless remained 10.2% above a year earlier, their largest annual increase since October 2022.
Goods excluding food and energy rose 0.5% for the month and accounted for more than 60% of the overall goods price increase. Food prices increased 1.3%, while energy prices edged by 0.1%.
Basic organic chemical prices rose 3.9%. Prices also increased for fresh and dry vegetables, gas fuels, jet fuel and processed young chickens, while pork and passenger car prices declined.
Service prices increased 0.2%, their fifth consecutive monthly gain. Within that category, final-demand trade service margins fell 0.2%, following a 2.1% increase in September.
Trade service indexes track changes in the difference between the prices wholesalers and retailers receive for goods and their acquisition costs. They do not measure sales growth or nindexes,it margins, and changes in these indexes are not equivalent to percentage-point changes in company profitability.
The margin index for machinery and vehicle wholesaling fell 4.2% in October, while the index for food and alcohol wholesaling increased. The differing results underscore the limits of applying the overall inflation rate to individual distribution sectors.
Further upstream, prices continued to rise for materials purchased for production and other business uses. Processed goods for intermediate demand increased 0.4% in October, their third consecutive monthly gain, and were 14.6% above a year earlier. That was the largest annual increase since July 2022.
Processed materials excluding food and energy rose 0.9% for the month. Electronic components and accessories, fabricated structural metal products and basic organic chemicals were among the categories posting increases. Lumber prices declined.
Unprocessed goods prices fell 3.1%, led by a 7.7% decline in unprocessed energy materials. Crude petroleum prices dropped 10.3%, while aluminum scrap, corn and wheat prices also decreased. Natural gas and carbon steel scrap prices increased.
Wholesale margin measures varied within intermediate demand as well. Margins for metals, minerals and ores wholesaling rose 9.2%, contributing to a 0.6% increase in intermediate service prices.
The final demand index excluding food, energy and trade services increased 0.5% in October, matching September’s pace, and rose 4.9% from a year earlier. That measure excludes volatile food and energy prices along with wholesale and retail margin changes.
The October figures are preliminary. The bureau also revised data for June through September to incorporate late reports and corrections from respondents.
Do not miss any content from Distribution Strategy Group. Join our list.
Share this article:
