Turn Customer Feedback Into Competitive Advantage
Customer Experience RX gives you the tools to go beyond surveys—so you can improve customer satisfaction and build loyalty with precision.

Drive measurable improvement in NPS – Identify root causes of satisfaction and dissatisfaction
Empower teams with clear next steps, not just charts
Prioritize initiatives based on what matters most to your customers
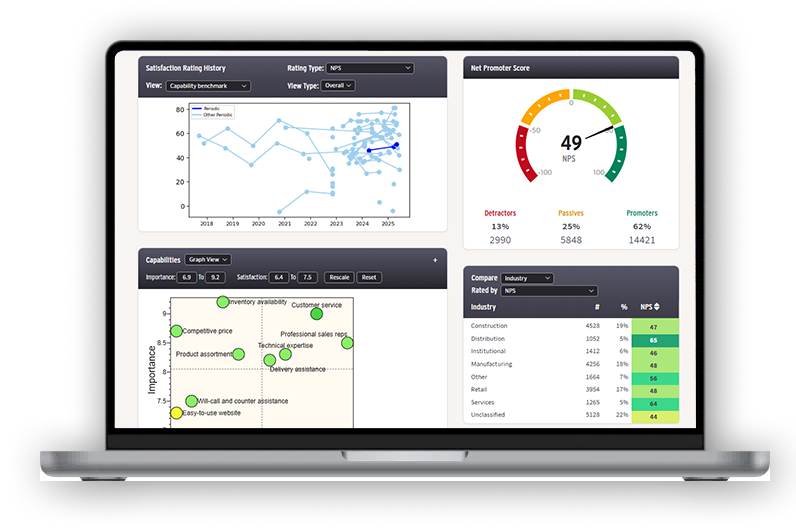
AI-powered sentiment and topic analysis Clear and actionable results through an easy-to-use portal
Closed-loop feedback tracking
Integration with CRM and service platforms
Customer Experience RX was built by distribution veterans who have performed hundreds of surveys.
It delivers what others can’t: direct paths from customer input to actions that increase satisfaction.

Schedule a Demo
See How DSG Software Can Drive Your Growth
Ready to turn insight into action? See how our software can help you capture more walletshare and improve customer satisfaction and employee engagement
You’ll discover the reasons behind an NPS score, including:
- What do customers like or dislike about their experience?
- Why do they give you a low score?
- Why do they give you a high score?
- What would improve their scores?

Customer Experience RX Provides The Full Picture
- How happy your customers are with every aspect of your customer experience
- What specific actions you must take to improve customer satisfaction and happiness
- Why customers stop buying from you and what you must to do keep them

Find out how to make your customers happier with our proprietary, easy-to-use, distributor-focused, low-cost Customer Experience RX!

Get the insights you need to take the right next steps
Over the past two decades, Net Promoter Score® (NPS®) has become the gold standard for measuring customer loyalty and a proven predictor of positive behaviors like repeat purchases, referrals, and increased share of wallet. But this metric is not enough, because it doesn’t provide the reasoning behind a customer’s response.
A deeper dive is required to determine actionable insights. That’s why Customer Experience RX is so critical to the success of your business.
Survey Smarter, Deliver Better
Customer Experience RX isn’t just another survey tool—it’s a transformative system that turns challenges into opportunities.
Designed For Distributors
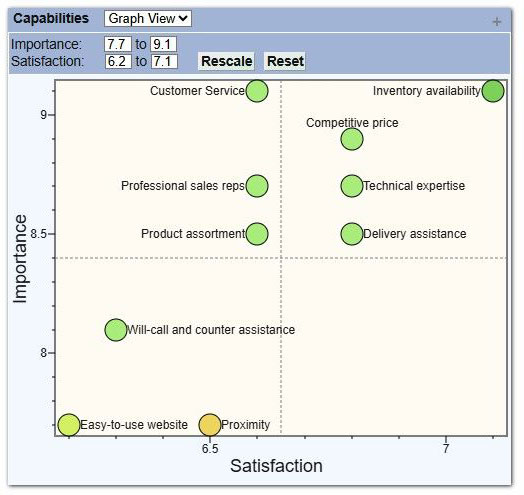
Tailored specifically for the unique challenges of distribution, our system identifies and prioritizes the capabilities and touchpoints that matter most to your customers.
Efficient and Effortless
Get comprehensive insights with minimal effort. From survey setup to analysis and recommendations, your total time investment is just a few hours per survey.
Finely Tuned and Optimized Surveys
Our six-minute surveys strike the perfect balance: long enough to gather valuable data, short enough to ensure a 90% completion rate.
Powerful Data- Driven Decisions
Leverage Net Promoter Scores and advanced segmentation to understand customer satisfaction across industries, job functions, geographies, and more. See where to invest for maximum impact.
Benchmarking and Sentiment Analysis
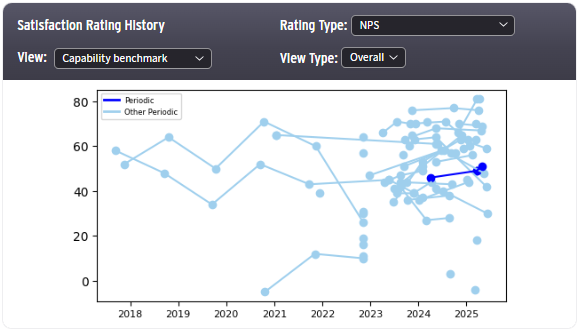
Compare your performance against peers in the industry and gain deeper insights with AI-driven sentiment analysis of customer feedback.
Seamless CRM Integration
Integrate your data directly into Salesforce, HubSpot, and other leading CRMs to empower your teams with real-time insights.
Implement our 3-Step Process in Hours
Craft the Survey
Collaborate with us to design surveys tailored to your customers and business needs. Define satisfaction metrics, segmentations, and touchpoints—all within an hour.
Send & Analyze
Distribute surveys via your platform or ours. With a 3–7% response rate and detailed statistical analysis, we deliver insights that are both accurate and actionable.
Present Results & Recommendations
Receive a comprehensive report with pinpointed diagnostics and prescriptive recommendations. Access the CX-RX portal for ongoing analysis and benchmarking.
Molly Langdon, SVP at Stellar Industrial Supply
Distributors using CX-RX have:
Identified high-impact improvements, such as reducing wait times, enhancing delivery accuracy, and simplifying billing processes.
Improved NPS scores by acting on precise, data-driven recommendations.
Gained a competitive edge by benchmarking against peers and identifying opportunities to excel.
What Our Users Say
The Distribution Strategy Group isn’t just a research partner—they’re a strategic asset to any organization serious about leveraging customer insights for continuous improvement and growth. I highly recommend their services to anyone looking to elevate their business through intelligent survey design and actionable analysis.
Kimberly Hunley
Director of Marketing – ARG Industrial
The experience with DSG was very simple, with limited time investment for set up. The outputs were easy to understand and always accessible via their application. I can target very specific sets of feedback I am looking to collect without recreating the wheel each time or incurring a large expense. Overall, a very good experience.
Scott Thomas
Sr. Director of Sales & Service – Parksite
Frequently Asked Questions
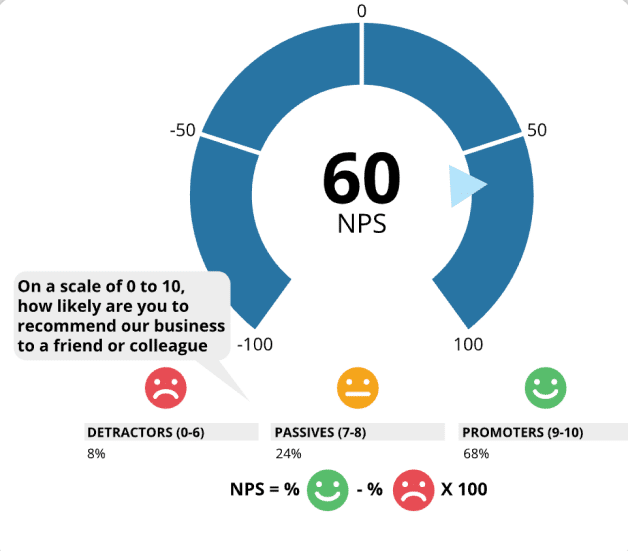
The Net Promoter Score is a widely recognized metric that measures customer loyalty by asking “How likely are you to recommend our business to a colleague or friend?” Responses are scored on a scale from 0 to 10, with higher scores indicating greater loyalty. CX-RX uses NPS as a foundation for understanding customer satisfaction.
CX-RX is specifically designed for distributors. It goes beyond simple survey tools by combining NPS with advanced analytics, benchmarking, and actionable recommendations tailored to your industry and business needs.
CX-RX is incredibly efficient. Survey design requires about one hour, survey management three to five hours, and data review an additional hour per survey. Most of the heavy lifting is handled by our team, so your involvement is minimal.
CX-RX is ideal for all distribution sectors, including HVAC, foodservice, construction supplies, industrial goods, and more. Its flexible design ensures it adapts to your specific industry.
Customer data privacy is a top priority. All data collected is securely stored and managed in compliance with industry regulations. Data is used solely for analysis and recommendations—never for third-party purposes.
Yes! CX-RX integrates seamlessly with leading CRMs, including Salesforce, HubSpot, and more. This allows your teams to access insights directly within their existing workflows.
The portal provides a centralized dashboard to analyze your NPS, customer feedback, and satisfaction trends. It includes features like heatmaps, segmentation tools, benchmarking, and sentiment analysis for a comprehensive view of your customer data.
Pricing is based on the number of surveys conducted, optional CRM integration, and the number of portal users. For two periodic surveys and one pulse survey pricing starts at just $17,250 annually.
Getting started is easy! Contact us at contact@distributionstrategy.com to schedule a consultation. We’ll guide you through the setup process and ensure CX-RX meets your unique needs.
Request a Demo
*Net Promoter®, NPS®, NPS Prism®, and the NPS-related emoticons are registered trademarks of Bain & Company, Inc., Satmetrix Systems, Inc., and Fred Reichheld. Net Promoter Score℠ and Net Promoter System℠ are service marks of Bain & Company, Inc., Satmetrix Systems, Inc., and Fred Reichheld.”
