Distribution Lags Behind Other Industries
Only 4 percent of respondents to the joint MDM-Distribution Strategy Group annual marketing survey said they are extremely satisfied with the results of their marketing initiatives.
By contrast, a Salesforce.com survey of 4,000 marketing executives in a range of B2B and B2C companies showed that 18 percent are extremely satisfied, reinforcing the notion that wholesale distribution and manufacturing, in general, have less mature marketing capabilities than other business segments.
Those within this survey who were highly satisfied with their marketing programs displayed clear differences in their marketing practices, most noticeably in digital marketing vehicles where companies are giving daily or weekly attention to email, search and social media. Other respondents said they aren’t devoting this much attention to digital. The highly satisfied group of respondents also decreased the frequency of in-store programs, including events and display merchandising.
Comparing the results of this year’s survey to 2011, the big shift is an increase in the frequency and importance of using digital programs. Print remains a popular marketing vehicle for distributors; the use of print catalogs increased from 2011 to 2016, although the size and circulation of catalogs decreased.
Satisfaction with marketing programs
In this year’s survey, we asked respondents to rate their satisfaction with results of their company’s marketing initiatives, a question inspired by the Saleforce.com survey. Respondents who answered “extremely satisfied” were classified as high performers; respondents who answered “very satisfied” or “moderately satisfied” were classified as moderate performers; and respondents who answered “slightly satisfied” or “not at all satisfied” were classified as underperformers.
While choices are clearly subjective, it provides an important baseline for comparing distribution against other business segments, and it also serves as a correlation variable for other questions in this survey. As shown in Figure 1, just 5 percent of distributors and 3 percent of manufacturers in
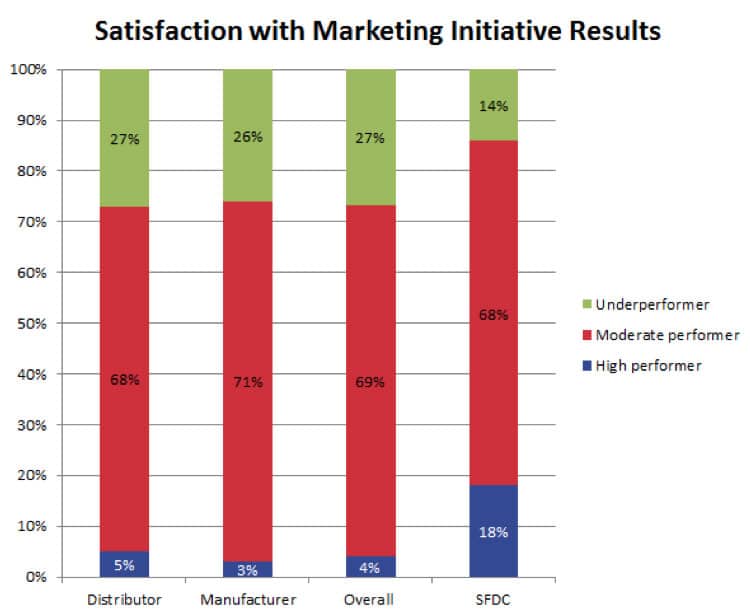
the MDM-Distribution Strategy Group survey are classified as high performers. Although the percentage of moderate performers is similar, respondents to the Salesforce.com survey (fourth column) were 4.5 times as likely to be high performers as respondents to the MDM survey.
In the inaugural marketing survey in 2011, we compared respondents who were on MDM’s Market Leaders lists against those who weren’t. MDM Market Leaders generally had more mature marketing capabilities than others. Data from this survey also showed that companies with revenue under $50 million were more likely to be underperformers than companies with revenue of $50 million and above.
Marketing vehicle frequency
Survey respondents were asked to rate the frequency of their marketing vehicles as daily, weekly, monthly, quarterly, annually or not at all. Figure 2 shows the total percentage of respondents who used each marketing vehicle in 2011 and in 2016.
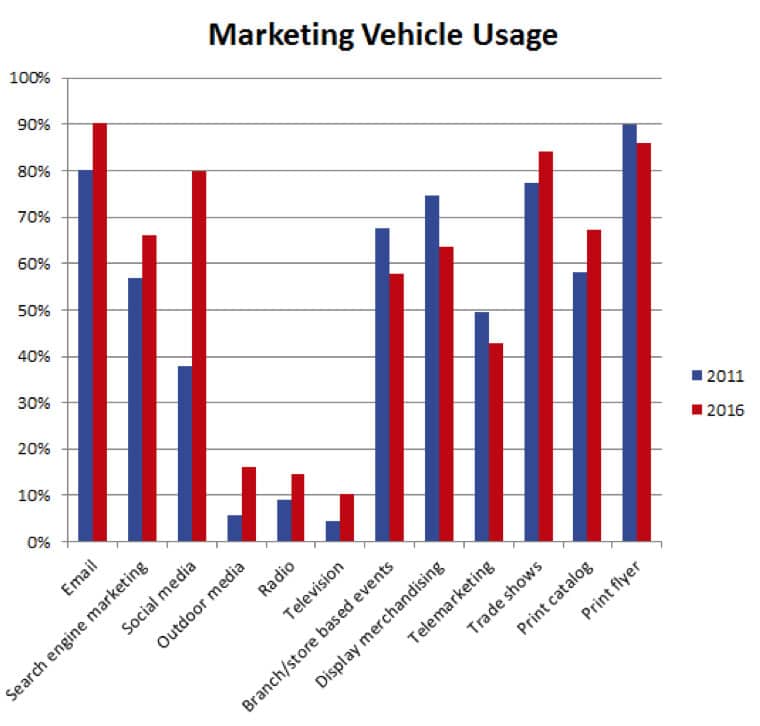
There are several notable shifts from 2011 to 2016:
- People and in-store – Except for tradeshows, there is a decline in the use of vehicles that involve people or in-store, including branch events, display merchandising and telemarketing.
- Mass media – Though small overall, there is a significant percentage increase in the use of mass media, including outdoor media, radio and television.
- Electronic/digital – There is solid growth in the percentage of companies using email marketing and search engine marketing. Email marketing is now used by 90 percent of respondents. However, the most astounding growth was seen in the use of social media, which more than doubled from 38 percent to 80 percent.
- Print – Print remains a significant marketing vehicle for many companies, and in the last five years there was a net increase in companies offering a print catalog. This is surprising because some industries, such as electronics, have abandoned print. Also, more manufacturers are participating in this survey than in 2011.
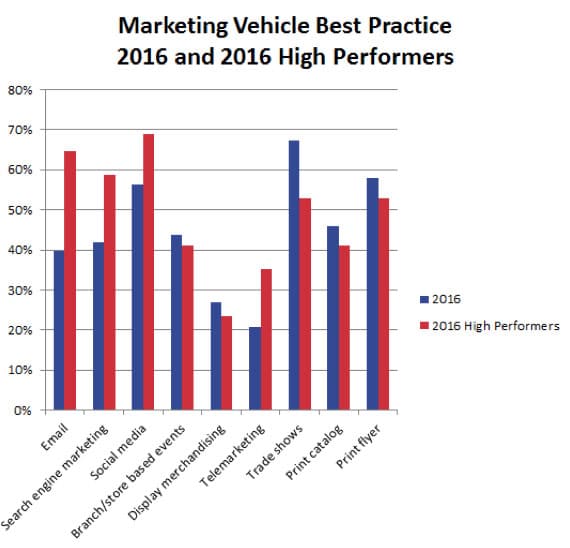
The best practices for frequency of contact through each marketing vehicle varies. For example, print flyers have the greatest effect when done monthly to quarterly. Anything more or less frequently yields weaker results, and possibly lower ROI. Table 1 displays our assumptions about the optimal frequency of marketing vehicles gauged in this survey, except mass media.
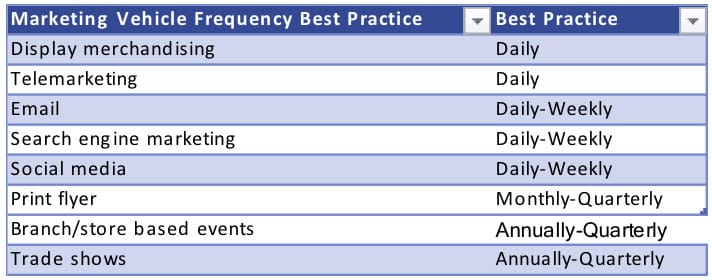
Overall, a higher percentage of companies are using electronic/digital vehicles on a daily or weekly basis now than in 2011. However, less than half of all companies using email are doing so daily or weekly, with one-third of companies using it monthly. Nearly two-thirds of companies that use social media do so daily or weekly.
Except for trade shows, the usage of people and in-store marketing vehicles declined from 2011 to 2016, as did the percentage that is using each vehicle with the proper frequency. Only half the companies that use display merchandising are doing it on a daily basis. A similar portion of companies that have a telemarketing function do so daily.
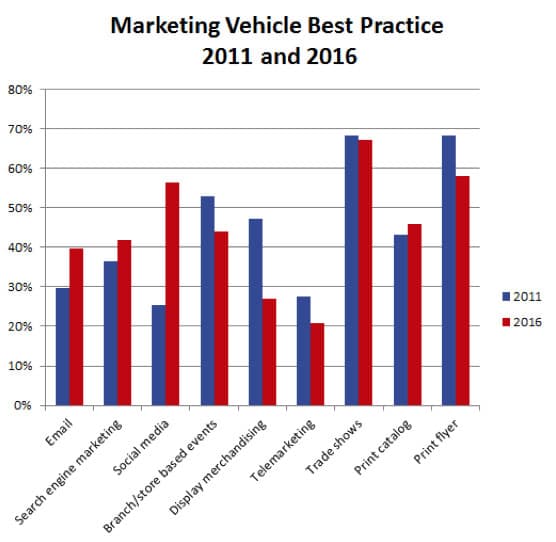
Using the same assumptions about best practice for frequency of using each vehicle, we compared the 2016 overall population against the 2016 high performers (see Figure 4). A much higher percentage of high performers – those who are extremely satisfied with their marketing initiatives – apply the best practice for frequency with electronic/digital vehicles.
The overall population and high performers are similar with regard to branch/store events and displaying merchandising, but high performers have a significantly higher percentage that do telemarketing daily. For moderate performers and underperformers, telemarketing likely entails branch personnel making calls to customers as time permits, which is usually far from daily. By contrast, high performers devote personnel to telemarketing and proactive inside sales, thus daily usage. The other notable difference is that the high performers do trade shows more frequently than quarterly or annually.
Marketing vehicle importance
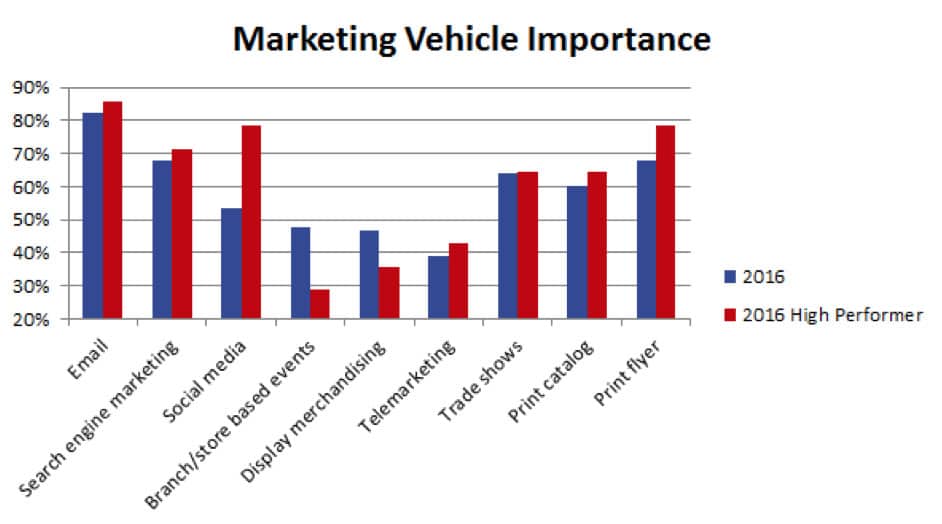
In addition to frequency of usage, the survey measured how respondents view the importance of each marketing vehicle (see Figure 5). High performers placed much greater importance on social media, and they placed somewhat greater importance on the use of print flyers. The overall population placed more emphasis on in-store vehicles, including events and display merchandising.
Areas for growth
Marketing practices are changing rapidly in distribution. Customers require a more efficient shopping and buying experience, and interactions that take five to 10 minutes instead of an hour will rule the day. This means a move away from in-store marketing vehicles toward digital.
Those who hope to compete – and in some cases survive – going forward must establish and improve capabilities in the following areas:
- Digital marketing. This includes search marketing, social media and email marketing/marketing automation. As shown with the data in this article, the high performers are doubling down on these vehicles as the best means to reach customers.
- Inside sales and telesales. At most distributors, employees with the title of inside sales are actually doing customer service. While they are active at serving the customer, they are passive at selling the customer. Shifting their roles to make them more active sellers can have a significant effect on overall results.
About This Survey
This research was conducted by Modern Distribution Management and Distribution Strategy Group through an online survey taken by 425 participants across a variety of distribution and manufacturing sectors. There was heavier participation from industrial, safety, electrical, electronics, building materials, oil and gas, HVACR/plumbing and hardware. Other participating sectors included janitorial, pulp and paper, chemicals and plastics, grocery/foodservice and pharmaceutical.
Nearly 50 percent of respondents were small companies with less than $50 million revenue, more than 40 percent of respondents have $50 million to $500 million in revenue, and the remainder have more than $500 million revenue.
More than half of the respondents have 10 or fewer branches, nearly a quarter have 10 to 100 branches, 10 percent have more than 100 branches, and 16 percent have no branch.
Jonathan Bein, Ph.D. is Managing Partner at Distribution Strategy Group. He’s
developed customer-facing analytics approaches for customer segmentation,
customer lifecycle management, positioning and messaging, pricing and channel strategy for distributors that want to align their sales and marketing resources with how their customers want to shop and buy. If you’re ready to drive real ROI, reach out to Jonathan today at
jbein@distributionstrategy.com.
