E-Commerce Continues the Maturity Journey
The sixth annual MDM distribution e-commerce survey conducted with Distribution Strategy Group revealed several key trends:
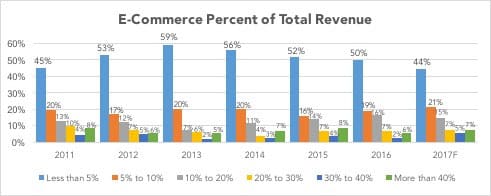
- The number of companies with at least 10 percent of their total revenue from e-commerce fell slightly by 2 percentage points from 2016 from 2015 – however, there was a 2% increase in the 10% – 20% category in the same time period.
- The primary objectives among respondents for e-commerce include acquiring new customers and increasing transactions, along with a strong emphasis this year on improving the overall customer experience.
- Distribution respondents lag manufacturers respondents in the maturity of their e-commerce journey.
This article examines the results of the 2017 State of E-Commerce in Distribution Survey and how the industry’s e-commerce offerings are maturing.
The 2017 State of E-Commerce in Distribution survey indicates the percentage of respondents with a mature e-commerce offering (at least 10 percent of total revenue through the e-commerce channel) decreased slightly by 2 percentage points from 2015 to 2016. At the same time, the percentage of respondents with 5 to 10 percent of total revenue from e-commerce increased from 16 percent in 2015 to 19 percent in 2016. Also important to note is a gain of 2% in the 10% – 20% category in the same period.
A few additional key points from the survey:
- companies with nascent e-commerce (revenue less than 5 percent) fell 2 percent, further supporting the move toward more mature e-commerce offerings,
- 42% of companies with e-commerce started 2011 or before, and
- 65% of companies in the 10% – 20% e-commerce range started 2011 or before.
We classify the stages of the e-commerce journey in the following manner:
- Nascent = Less than 5% of e-commerce revenue
- Growth = 5% – 10% of e-commerce revenue
- Maturity = 10% – 20% of e-commerce revenue
- Leader = > 20% of e-commerce revenue
As in prior surveys, expected revenue percentage for the current year shows aggressive growth compared to actual revenue percentage in the prior year. The estimated percentage of revenue in the nascent stage is forecast to reduce by 6 percentage points in 2017 versus 2016 with the move toward maturity. This forecast change appears to be much more in line with what actually may occur in 2017. The phenomenon of irrational exuberance that we have seen in prior years seems to be rooted more in reality for the 2017 forecast. This may be due to two things; first is the continued move out of the nascent phase to the growth and maturity phases and second, company personnel becoming more familiar with actual time and effort required to implement an e-commerce platform.
Manufacturers that responded to the survey are clearly further down the path in their e-commerce journey than distributors. There was a significant change in the stages of maturity with manufacturers. In 2015, 57% of manufacturers reported e-commerce as less than 10% of total revenue. Fast forward to 2016 and these same manufacturers had just 41% of revenue, or a drop of 17% in the under 10% category. The aggressive shift saw a 15% shift to the 10% to 30% categories and a 3% increase in the more than 40% category. Manufacturers are clearly and aggressively embracing the e-commerce channel.
Distributor respondents, on the other hand, did see a 7% drop in the nascent stage, with a 7% corresponding gain in the 5% to 20% categories. Distributors are shifting their journey from nascent to more mature stages, but are doing so at a slower pace than manufacturers.
The differences in manufacturer and distributor respondents point to a bold action need for distributors. Manufacturers clearly see the need for e-commerce and are advancing toward growth and maturity. This e-commerce offensive by manufacturers could be a disruptive change for distribution. Distributors that are not aggressively embracing e-commerce face a quandary; get on board quickly or manufacturers may go around them.
Manufacturers indicated that a key factor when adding new distributors is evaluating how robust is the distributor’s e-commerce channel. The intimation is that manufacturers know the path to more sales resides in offering products in multiple channels, with e-commerce driving the change and intend to succeed with e-commerce.
In follow up interviews to this survey, manufacturers added clarity to this idea; they don’t have time to nurture distributors without solid e-commerce options and will more aggressive secure and support distributors that do offer a strong e-commerce channel. One distributor described in detail a new distributor that was aggressively adding short videos showing and describing benefits of their products. In that example, it was one way that distributor was driving big growth to their e-commerce, but it was also one where the manufacturer supported the distributor with script writing, etc., to more quickly add relevant product content – in this case, video.
Manufacturers and distributors alike often identified Amazon as the standard in terms of the user experience, especially in the order and fulfillment aspects. Some distributors identified Amazon Business as a significant threat. At Distribution Strategy Group, we see Amazon more as a great example of how a general user experience can be, however there is plenty of room for distributors to succeed in the e-commerce channel and be the preferred supplier. In our research covering nearly 20 distributors, one key take away is that each distributor is unique. Specifically knowing how customers want to shop (find and select products) versus buy provides a valuable foundation to an e-commerce strategy and roadmap. We have had a client ready to spend nearly $1 million on an e-commerce platform, but discovered their customers largely purchased offline, negating a major technology investment. Conversely, we have had distributors who thought their customers wanted to buy from their sales people. The research pointed just the opposite, and caused the distributor to invest in and drive the e-commerce channel based on customer needs.
Knowing the specific niches customers participate in often points to changes in how product data and content is written and shown. A “one-size fits all” approach to product data and product content can be short-sided, especially to be found in Google and Bing searches.
The following chart indicates where distributors get product information and content.
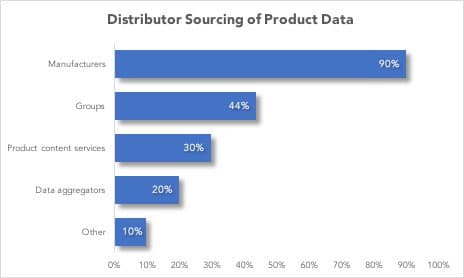
The following are definition of the sources:
- Groups: for example, co-ops, buying groups, or industry associations
- Product content services: examples include Unilog, Codifyd, or trade services
- Data aggregators: includes IDEA, ThomasNet, etc.
- Other: most often includes internally sources from the distributor
Another factor is getting found by search engines – if dozens of distributors have the exact same product descriptions, who shows up higher in the Google SERP (search engine results page)? Many factors go into that answer and goes beyond the scope of this article. However, the key is understanding how customers search for products and developing product descriptions that more closely match the needs of the customer searches. Many distributors view that as a daunting task that never gets done. Product data and content is a continuous journey, not a one-time event. Distributors that excel in this resource acquisition of product data as an on-going cost. Starting to tweak the descriptions of top SKUs and continually working down the list is a key long-term best practice.
E-Commerce Priorities
The top priorities for e-commerce, as shown below, are:
- Increase new customers and orders
- Improve the customer experience, and
- Increase frequency of use and transactions.
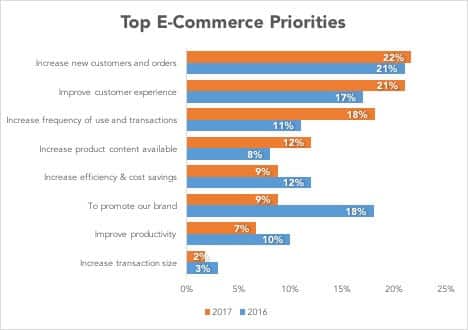
A notable difference is the decrease of the mention “to promote our brand” from 18% in 2015 to just 9% in 2016. As the journey to maturity marches on, priorities are shifting as a result to take advantage of the revenue aspects of the e-commerce channel. Specifically, the categories combining gaining new customers and increasing frequency of use increased to 40% in 2016 versus 32% in 2015.
As the shift to maturity continues to place more emphasis on the transactional aspect of the e-commerce channel, improving the customer experience and product content available also changes to support transactions. These combined categories were at 33% in 2016, up from 25% in 2015.
Moving Forward
As we discussed, product data is the foundation of most B2B distribution sites, and it should be thought of as needing daily exercise through continual updates. If multiple websites show the exact same product data, search engines will attempt to select which site is the “authoritative” version of that data. This makes search engine optimization (SEO) a critical element of an e-commerce strategy.
This year’s research shows transactions as a key priority. Supporting a transactional site means having product content that is most relevant to users. Another aspect of supporting a transactional site is the continuous monitoring and improvement of the customer experience. Clearly understanding customer needs and requirements is critical to compressing the time from the nascent stage to a mature e-commerce channel.
Part 2 of this research will dive into best practices of driving demand and keeping visitors engaged.
About This Research
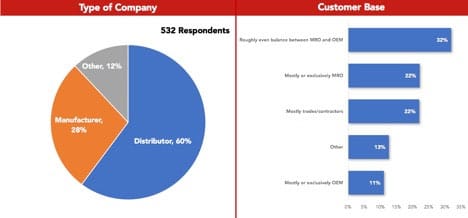
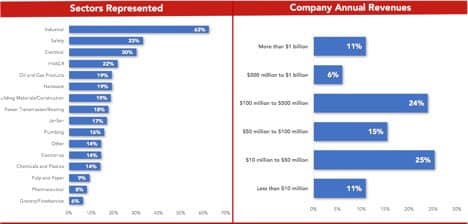
This research was conducted by Distribution Strategy Group with Modern Distribution Management. The research included an online survey taken by 532 participants across a variety of sectors. Of those identifying as either manufacturer or distributor, 68% were distributors and 32% were manufacturers.
There was heavier participation from industrial, safety, electrical, building materials, janitorial, oil and gas products, JanSan, HVACR/plumbing and hardware, power transmission/bearings. Other participating sectors include chemical and plastics, pulp and paper, grocery/foodservice, and pharmaceutical.
About one-third are small distributors with less than $50 million revenue, nearly 40% are mid-market with $50 million to $500 million, and 17% are large with more than $500 million revenue. The remaining 10% did not disclose the revenue range.
About 32% are primarily focused on MRO; 11% are focused on OEM customers; 19% serve trades/contractors; 22% are an even blend of MRO and OEM; and 13% are in other categories.
Dean Mueller is Independent Consultant at Distribution Strategy Group. He has more than 30 years of experience in sales and marketing and helps distributors build holistic digital strategies that drive a significant shift to online sales, improve profitability and grow customer satisfaction. Take your digital strategy to the next level. Contact Dean at dmueller@distributionstrategy.com.
