The E-Commerce Journey Continues to Evolve
Part 1 of this research showed the continued trend of distributors moving from the nascent stage, or less than 5% of revenue going through the e-commerce channel, to the growth and maturity stages. There was a shift toward growth, with a 3% increase in the band of companies having e-commerce revenue totaling 5% – 10% and a 2% increase in those in the 10% – 20% band.
The shift moving towards e-commerce maturity means the journey evolves as well. As noted in Part 1, the top e-commerce priorities are shifting to transactional priorities. Part 2 will explore what is changing and what that could mean for your business.
The e-commerce initiatives are indeed a journey. Continuous improvement is required to adapt to the ever-changing customer expectations. Amazon, Grainger, and other world-class e-commerce sites are constantly monitoring customer needs and making modifications that result in better conversion, customer stickiness, or other operational improvements. The UX (user-experience) bar is continuously raised. It is not enough to have an e-commerce site; the user experience must be good, or even great.
This year’s research correlates to this journey by showing strong increases in “improving customer experience” and “increasing product content available”. The latter is just one specific way to enhance the customer experience and making it easier to find relevant product information. The better and more relevant the product information is, the greater the probability for increased conversions.
Several aspects of the e-commerce journey were explored in this year’s research. Distribution Strategy Group has conducted this research for six consecutive years with distributors, and now has enough data to begin segmenting distributors into three classifications to describe their e-commerce performance in terms of percent of total revenue.

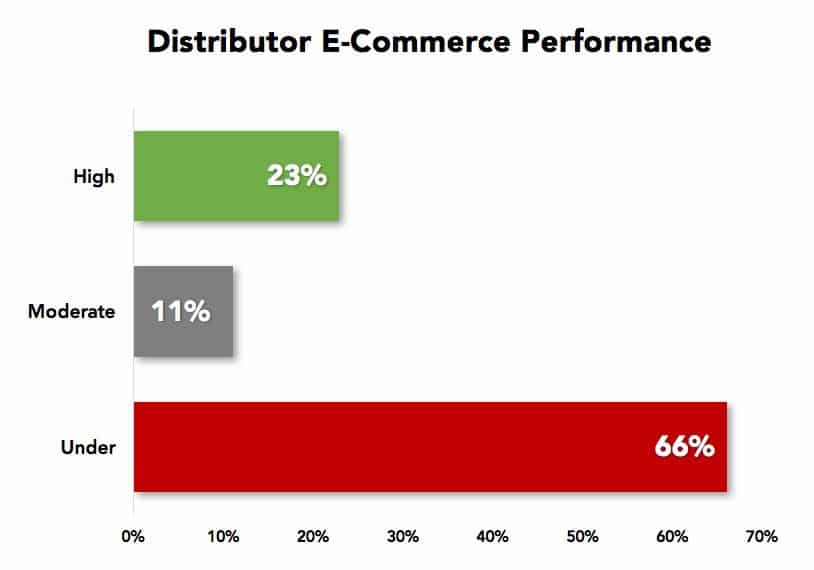
In the above chart, 23% of distributors responding to the survey fell into the High Performer category because they moved to 10% – 20% of e-commerce revenue within 5 years, or they have > 20% of total revenue in the e-commerce channel. 11% of respondents fell into the Moderate Performer category, meaning it took them more than 5 years to get to the 10% – 20% band. The Under Performer category represents two-thirds of the respondents, either staying in the nascent band for more than 3 years or in the 5% – 10% band for more than 5 years.
The goal is to compress the time it takes to get
to the growth and maturity stages.
Compressing the time from e-commerce launch to maturity does not just happen. Building and launching a site does not translate into success. That’s where strong and effective marketing comes in.
Marketing Vehicle Effectiveness
The 2017 survey continues to highlight the importance of sales reps and customer service to drive e-commerce demand. The interesting change this year is the move of SEO (search engine optimization)/organic search from the number four position to the number two position in terms of effectiveness in driving demand to the e-commerce channel.
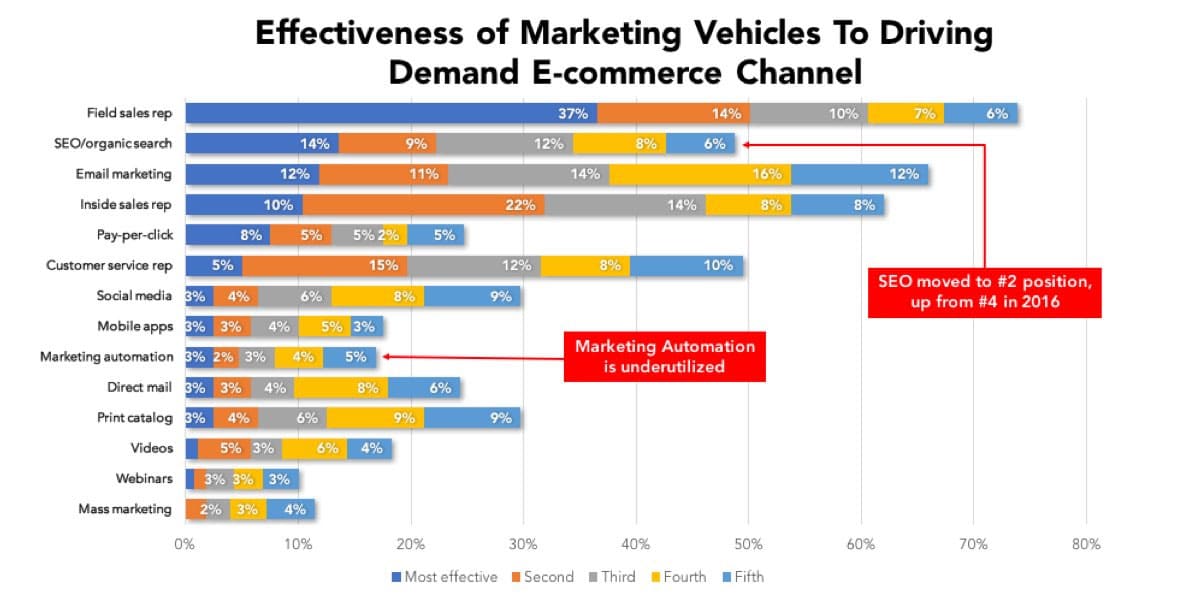
The overall length of the bars in the above chart are indicative of how frequently distributors that are using a particular marketing vehicle/tool.
Notable is the one-year decline in the usage/effectiveness of print catalogs. This year’s survey shows the addition of the top five mentions to about 30%, which is a large drop from last year’s number of 42%. Depending on industry sector, our clients still see a good revenue lift opportunity with the usage of print catalogs and/or print flyers. There can be significant conversion differences in print vehicles; those distributors that have a solid value proposition being communicated along with promotional-type of content have seen good revenue growth.
Knowing the e-commerce priority changes discussed in Part 1 and touched on here, improving the overall customer experience is keenly important to drive up conversion rates and revenue. One marketing tool that is very underutilized by distributors is marketing automation. Email marketing is highly utilized and does provide a good way to keep in touch with customers. Marketing automation begins where email marketing capabilities peak. It can be a terrific tool, when used properly, to provide highly relevant and behaviorally-based communication. Bottom line; it is a tool that can help increase conversions. Much more information about marketing automation can be found on our website at distributionstrategy.com.
Spending Rank by Marketing Vehicle
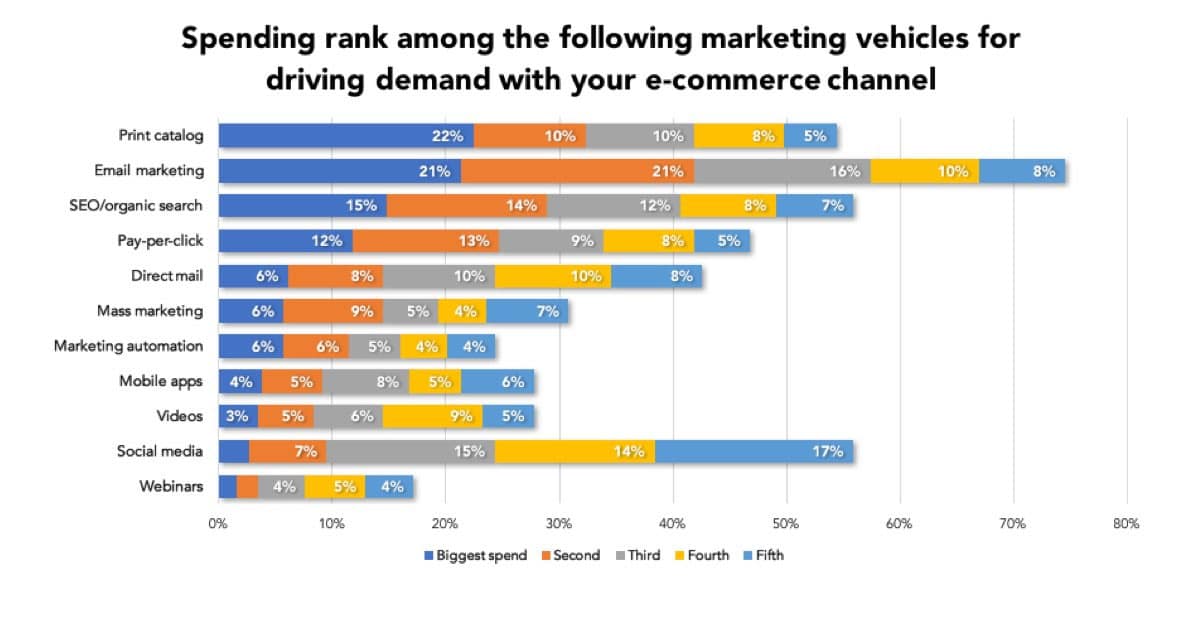
Now that the effectiveness of marketing vehicles has been outlined, the next question is: where are distributors spending their marketing dollars? While distributors say the effectiveness of the print catalog is reducing, it is still the tool receiving the largest spend. Email marketing is a close second, with 21% of respondents saying it is the biggest spend. SEO and PPC (pay-per-click) are the next top areas with the largest spend. Adding both SEO and PPC together to create a “search” category, it would equal 27% and be the highest spend.
Considering the journey evolution and shifting emphasis toward user experience, it is natural to place significant resources to continued improvement of SEO and PPC in order to make it easier for a user to find what they seek. Distributors with branches have a built-in benefit over online businesses such as Amazon, in that they could optimize local SEO for branch locations (in addition to the myriad of other value-added services). With more and more mobile searches, Google places strong emphasis on sites that are mobile-optimized and rewards those with good local SEO with higher organic rankings in certain searches. Spending a few resources to optimize the local SEO is just one SEO strategy but an important and often overlooked one.
When search is discussed, it is crucial to consider how good the user experience is when search on the e-commerce site. A simple example: if a user seeks a “hammer drill”, putting that into the on-site search and returning a hammer, for example, will quickly frustrate a user who may go elsewhere for their purchases.
Satisfaction with E-Commerce Resulting from your Investment?
Earlier in this article the idea of high, moderate, or under-performing distributors relative to their e-commerce was introduced. Respondents were asked to rate their satisfaction with the company’s e-commerce as a result of their e-commerce investment. The following chart depicts satisfaction by distributor performance categories.
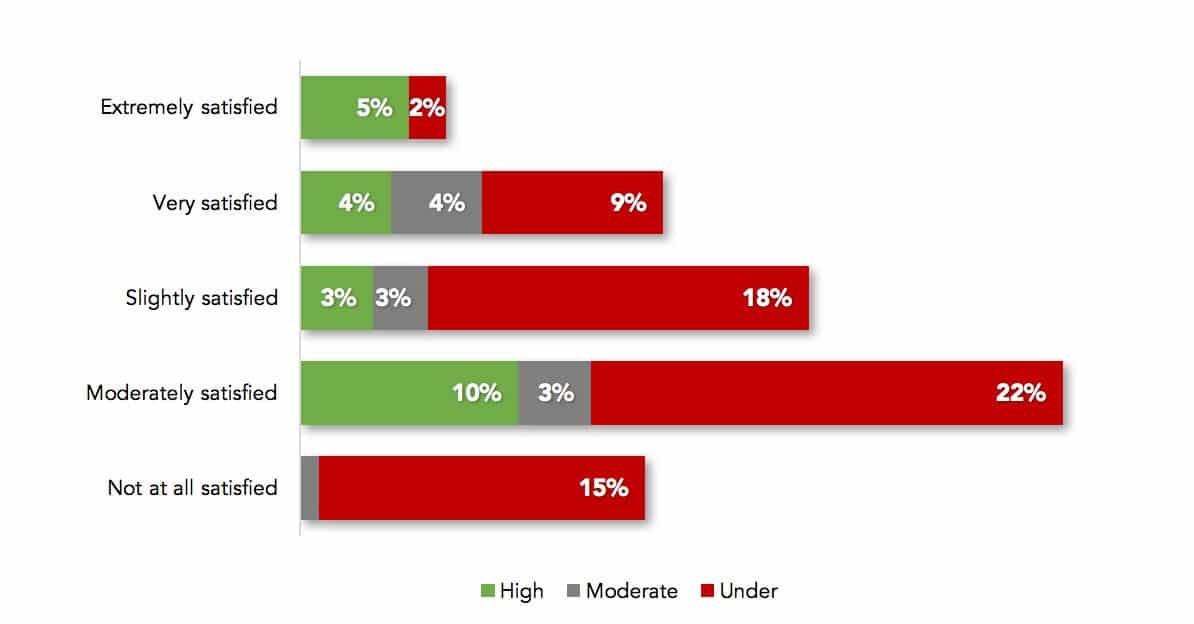
There is no surprise to see under-performing distributors not being satisfied. Under-performers that are either extremely satisfied or very satisfied may have either recently upgraded their e-commerce implementation or have a low success threshold.
High-performing distributors that are moderately or slightly satisfied may have a higher expectation of success for their e-commerce initiative. Regardless of which category a distributor falls into, the key is continuous improvement. Customers’ expectations are constantly evolving, and e-commerce sites must evolve to keep customers and gain new ones.
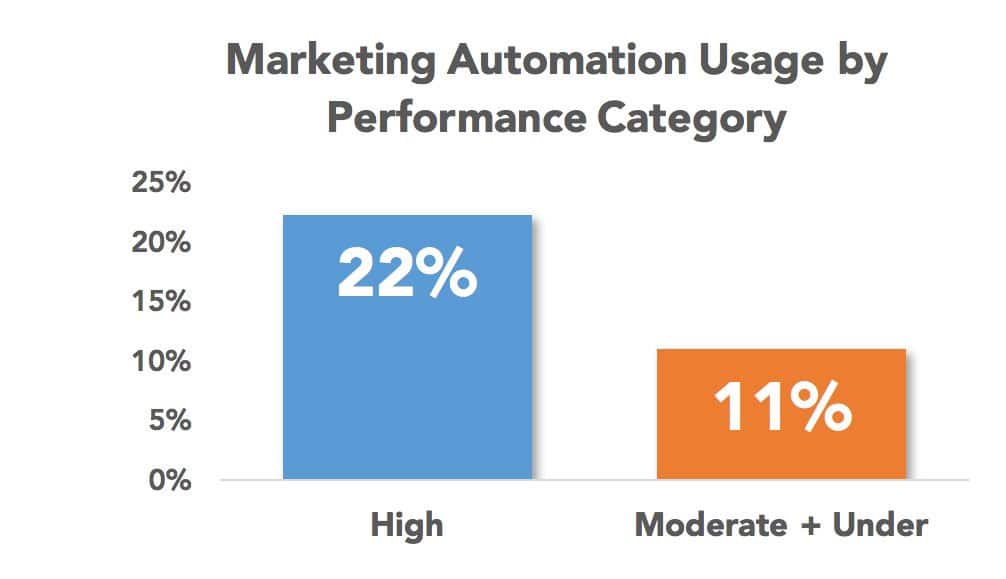
Marketing automation has been mentioned in this article as an underutilized tool. The chart below shows usage of marketing automation by the high-performing distributors versus the moderate and under-performing distributors. As the graph indicates, marketing automation is used twice as much with high-performing distributors. With all that being said, there is much opportunity among the high performers to adopt this tool.
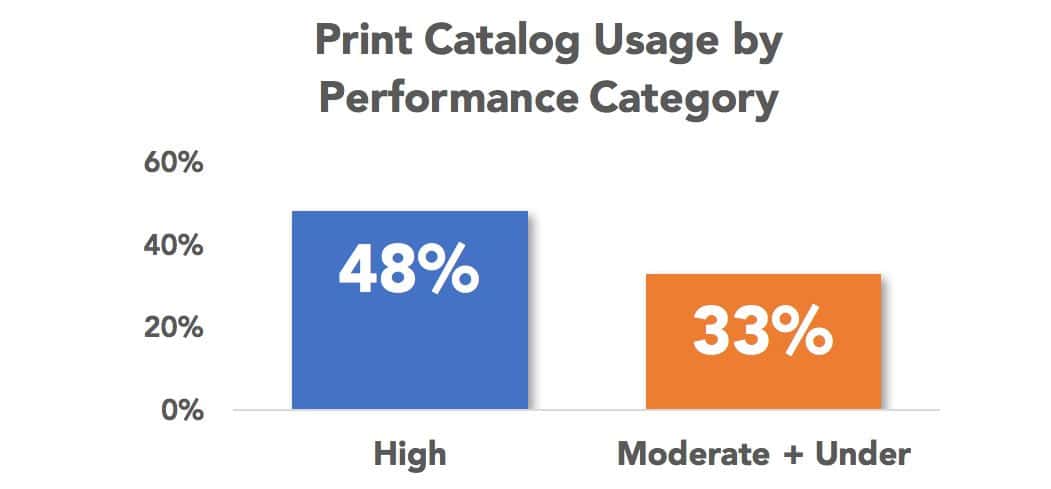
The print catalog is still the highest spend with distributors. The graph below shows the difference in usage between the high performers versus the others. Again, print catalog is utilized more by the top performers.
Along with continuous improvement of the user experience, distributors have a tremendous opportunity to compress the time in the nascent and growth revenue stages along the way to being in the mature e-commerce bands. Aggressive marketing is critical. Distributors have a major opportunity to effectively market their e-commerce site.
About This Research
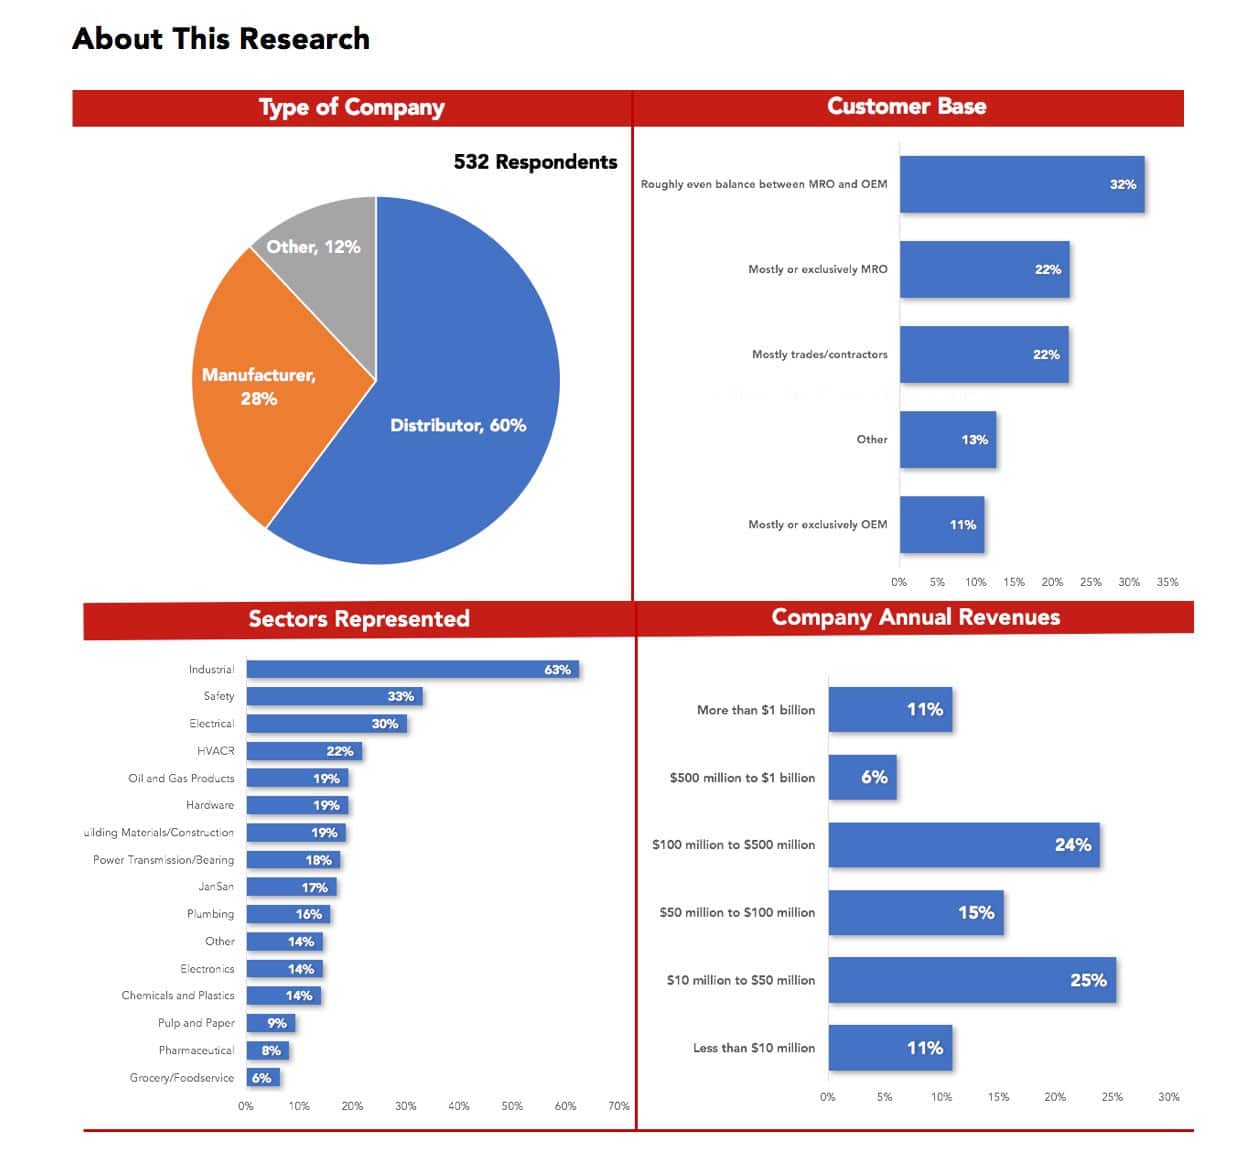
This research was conducted by Distribution Strategy Group with Modern Distribution Management. The research included an online survey taken by 532 participants across a variety of sectors. Of those identifying as either manufacturer or distributor, 68% were distributors and 32% were manufacturers.
There was heavier participation from industrial, safety, electrical, building materials, janitorial, oil and gas products, JanSan, HVACR/plumbing and hardware, power transmission/bearings. Other participating sectors include chemical and plastics, pulp and paper, grocery/foodservice, and pharmaceutical.
About one-third are small distributors with less than $50 million revenue, nearly 40% are mid-market with $50 million to $500 million, and 17% are large with more than $500 million revenue. The remaining 10% did not disclose the revenue range.
About 32% are primarily focused on MRO; 11% are focused on OEM customers; 19% serve trades/contractors; 22% are an even blend of MRO and OEM; and 13% are in other categories.
Dean Mueller is Independent Consultant at Distribution Strategy Group. He has more than 30 years of experience in sales and marketing and helps distributors build holistic digital strategies that drive a significant shift to online sales, improve profitability and grow customer satisfaction. Take your digital strategy to the next level. Contact Dean at dmueller@distributionstrategy.com.
