When we ask successful distribution company executives about the sweet spots in their market, they readily provide a confident answer. The problem with the answer is that it is usually incorrect or at best partially correct. A detailed, analytic look at their customer base shows that some market segments are over-rated by them, some under-rated, and others are ignored or undetected altogether.
While these executives sincerely believe their answer, there are several reasons why their answer is at variance with data about the customer base. The first is shifting market conditions such as a downturn or upturn that change where the sweet spots are. With the recent upturn, some of the segments that were strong prior to the downturn have comeback but others have remained down.
The second reason is that many executives have exposure to only a limited portion of their customer base, often the largest customers. As a result they mistake the set of customers they have visited as being representative of the rest of the market.
Finally, many executives know generally which market segments are attractive, however they are unfamiliar with the sub-segments. So, it is difficult to take meaningful action based on an imprecise classification of customers.
Simply put, one cannot tell who the players are without a scorecard. As Daniel Kahneman, the Nobel Prize winner in economics says, even “Statisticians are not very good informal statisticians.” This is all the more true for executives who may have limited statistics background.
Effective segmentation allows for messaging and targeting to key segments in a language that makes sense to them (different industries often use different terminology). Good segmentation also allows prioritization of customers by sales potential and ease of penetration.
In this article, we look at how customer firmographic data – the specific characteristics of a company – and distributor transaction information can be used to get sales quick hits in market sweet spots.
Our method is very simple:
- Obtain firmographic data on your customers.
- Gather annual revenue, gross margin, orders, and line items for each of your customers over a three to five year period.
- Combine the firmographic data with the transaction data to analyze by individual firmographic variable such line of business or by pairs of firmographic variables such as line of business and number of employees. A key premise in this approach is to build on success that you are already having in the market, and to do that you have to be able to accurately identify where that success really is. Relying on an analyst report that predicts general trends in the market may not apply specifically to your company for one reason or another.
Firmographic Variables
Firmographic variables are the specific characteristics of each company, including line of business, annual revenue, number of employees, location and year of founding.
Line of Business
Line of business information can be SIC or NAICS data. It can also come directly from an information provide such as D&B who has their own industry taxonomy.
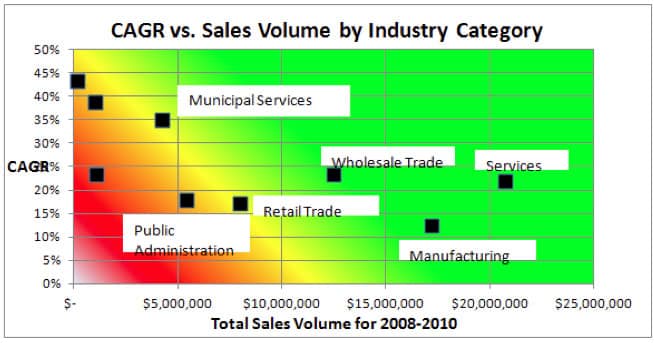
The example In Figure 1 shows revenue volume (horizontal axis) and compounded annual growth (vertical axis) for a company that sells high-tech office equipment. Before analyzing the data, they believed that their best segments were retail stores and manufacturing.
However, the analysis showed that wholesale trade and services each have higher annual growth rates than retail trade and manufacturing. In addition, wholesale trade had higher volume than retail trade, and services had higher volume than manufacturing. Further analysis revealed that although there were many retail clients, most were small customers who were receiving deep and unnecessary discounts. So, this distributor was not only able to determine where to apply more sales and marketing efforts, but also to reduce superfluous discounts.

Size
When determining the size of a company, we typically look at annual revenue and the number of employees. The reason we look at both variables has to do with the reliability of data either directly from the customer or from third-party sources such as D&B, InfoUsa or Axciom. Most companies are more likely to report their number of employees than their annual revenue.
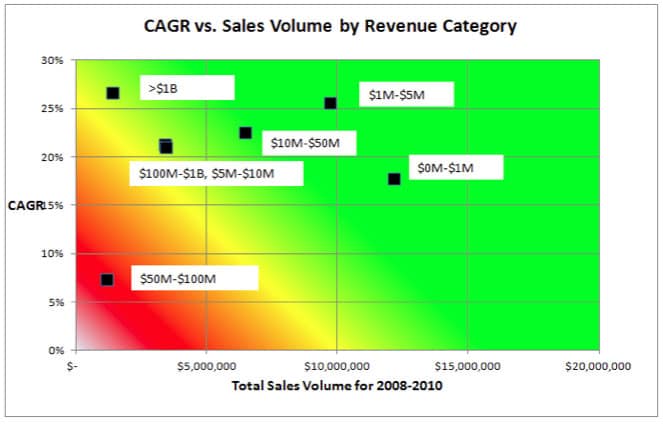
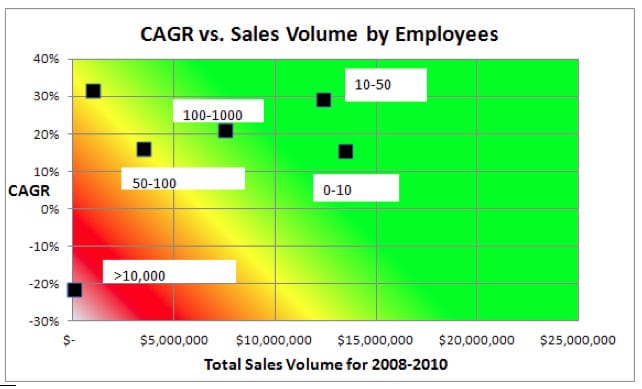
Analysis of the size data in Figure 2 and Figure 3 showed that the high-tech office equipment distributor had much better success with small companies that have less than $5 million revenue and fewer than 50 employees. Based on this, we recommended further focus of their inside sales group to specialize on the small business segment with a smaller set of products as a means to reduce cost of acquisition and cost to serve.


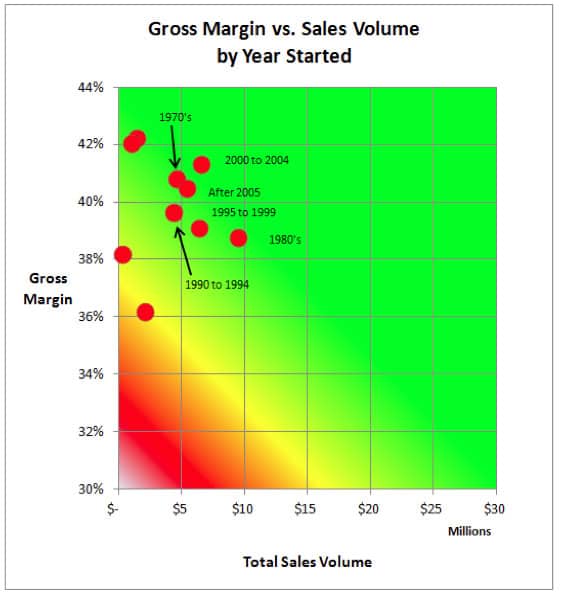
Year of founding Year of founding may not seem to be an obvious indicator to everyone, but our work has shown it to be a powerful segmentation variable in several cases. There is not a clear-cut trend for how it correlates to each company; for example, older companies are not always better prospects. In the example in Figure 4, the highest volume segment for the distributor is companies started in the 1980s. For distributors who sell to OEMs, we have seen a trend that newer but not the newest customers are the best prospects. With another distributor who sells to high-tech companies, their best prospects were founded between 2001 and 2005, yet their worst prospects were founded between 2006 and 2010.
For this distributor, there is a balance in finding OEMs who are new enough to need the distributor’s high-tech components but old enough to be successfully selling in-market. For another distributor of green products, their best segments are companies that are environmentally conscious. This includes new millennium companies as well as churches and schools that were formed before 1950.

Two Variable Analysis
The examples that we have shown so far are all focused on a single firmographic variable. It is often useful to work with two variables. For example, line of business and customer revenue. The precision of two variable analysis is more actionable whether the goal is wallet share expansion or new customer acquisition. Three variable analysis tends to be too complex and the segments too small to be meaningful.
Conclusion
The best way to get quick sales hits is to know where the sweet spots are and to replicate that success. The examples that we have included do not require a degree in statistics to understand: insights leap off the page to even the casual observer.
Besides showing segments where additional sales volume can be easily captured, this method of segmentation can also highlight problem areas. One of our clients who sells HVAC equipment believed that their best segments were HVAC contractors and electrical contractors. While both segments were high volume, the electrical contractor segment was actually negative growth over a multi-year period.
Upon learning this, the distributor was able to determine whether there was a problem with their offering or service, or whether it was just the economy. Even more important, we uncovered a segment that although was not as large as HVAC contractors or electrical contractors was growing at 40 percent per year. They have made significant market gains in that segment with targeted list purchases and marketing campaigns.
Jonathan Bein, Ph.D. is Managing Partner at Distribution Strategy Group. He’s
developed customer-facing analytics approaches for customer segmentation,
customer lifecycle management, positioning and messaging, pricing and channel strategy for distributors that want to align their sales and marketing resources with how their customers want to shop and buy. If you’re ready to drive real ROI, reach out to Jonathan today at
jbein@distributionstrategy.com.
