Distribution is the most competitive sector of the American economy. This means that for most firms profit levels are adequate, but somewhat unexciting. This is not an indictment of management; it is simply an awareness of the competitive situation.
The profit doldrum is not a recent invention. Exhibit 1 examines some ancient history for profit performance in distribution. The years (1998 to 2012) were chosen because they show the clear impact of both growing economies and recessionary ones without the more recent impact of pandemics and hyper-inflation.
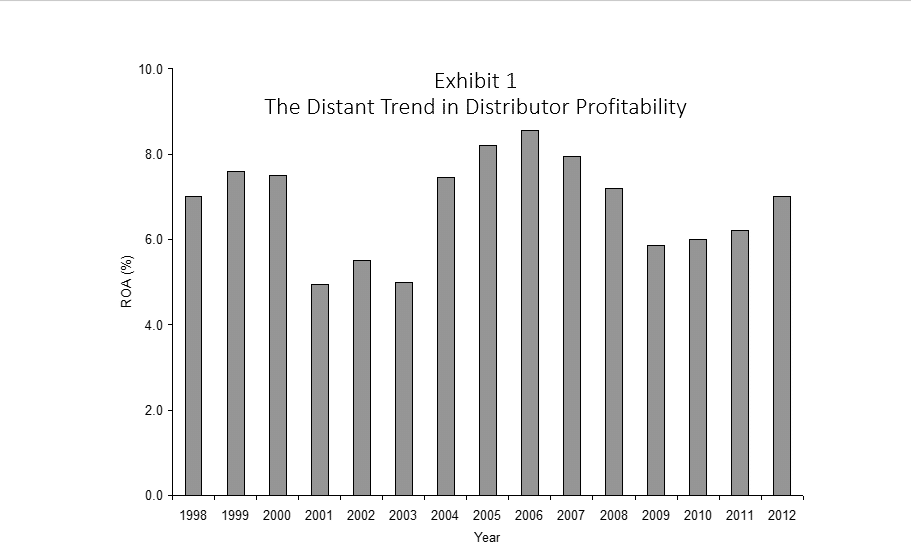
As can be seen, Return on Assets (pre-tax profits as a percent of the total investment in the firm) rises and falls with economic conditions. Of greater importance, results inevitably return to the historical average. There is clear regression to the mean, typically 6.0% to 7.0%.
The stagnant trend continues to this day. What is different is more random changes to profit in a single year, both up and down. What is not different is the constant 6.0% to 7.0% profit performance.
The profit stagnation is not due to management inaction. Firms have been active in a variety of ways, ranging from M&A to achieve economies of scale, to employing new technology, especially AI, to expanding their online presence, to developing new ways to drive employee engagement.
It is not what they are doing that could increase profitability. Instead, it is what they are not doing. Specifically, they are not finding ways to get around the four ongoing barriers to profit improvement.
There are four barriers that have been around since the dawn of time. Some of them are strategic, some are operational. All of them have the potential to change profit results in a major way if they can be overcome.
Reviewing The Four Barriers To Stronger Profits
Hockey-Stick Planning: Top management is inevitably optimistic and aggressive. Basically, “There ain’t no mountain we can’t climb.” Such enthusiasm is great in motivating employees and building a winning culture. However, it flies in the face of the reality of profitability trends.
If the long-term trend is somewhat stagnant, deviating from the trend has to be a difficult undertaking. Consequently, making the great leap forward in terms or profitability is probably doomed to failure. Having said that, firms inevitably develop the great one-year plan of higher profit.
As can be seen in Exhibit 2, this is what is typically called the hockey-stick approach to profit improvement. The long-term trend is going to be shattered in one year. Forget the twenty-year history of steady performance. This is the year!
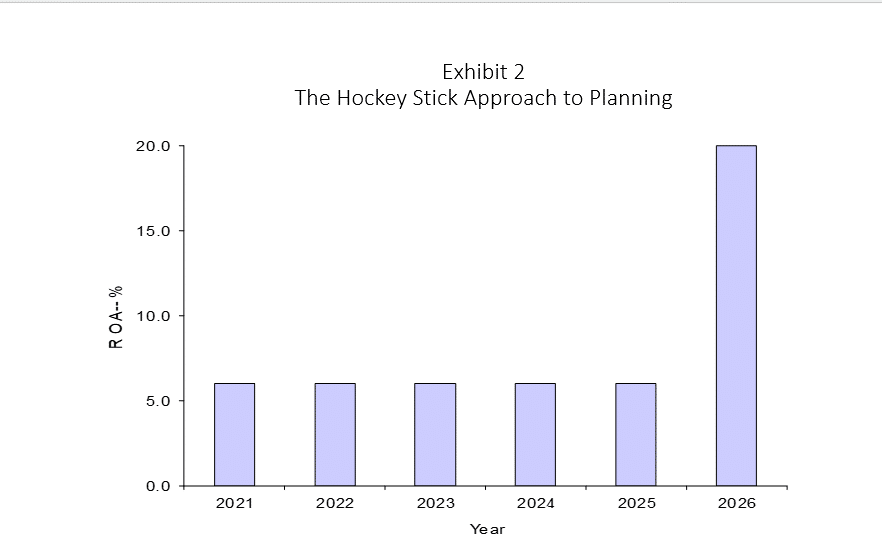
As difficult as it is to accept, permanent profit improvement most often comes from setting smaller goals that the firm can meet. That process can then be repeated with another likelihood of success. In a three- to four-year time frame, the firm can break out of the pack.
Me Too: A common lament among distribution executives is that customers are only interested in the lowest price. That may well be true in some instances. However, research conducted over the last twenty years or so (including by Distribution Strategy Group) always indicates that price is ranked fourth or fifth among customer needs.
Instead of price, customers are much more concerned about key operating issues, such as a supplier’s service level, the depth of its assortment and its response time. These items always outrank price in importance.
The problem arises when every competitor has about the same service level, the same assortment, the same speed of delivery and the like. In that instance, price becomes the only real competitive factor that matters.
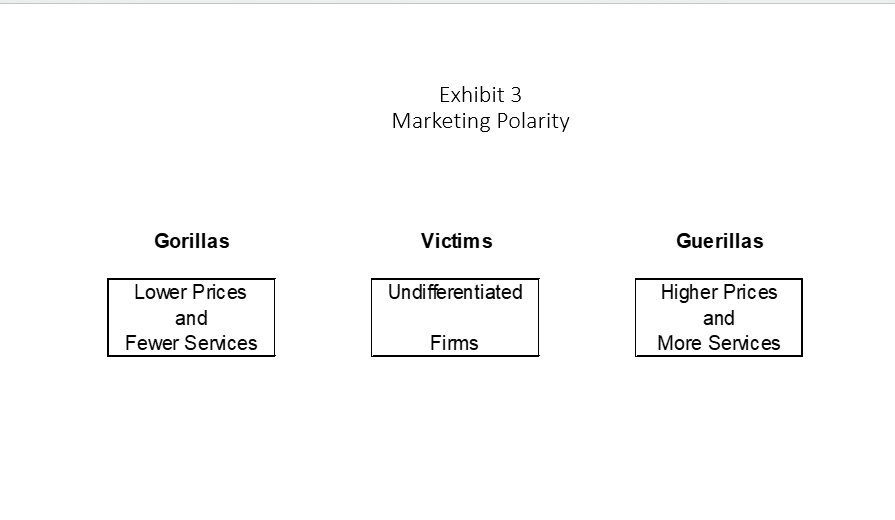
Escaping the me-too trap requires developing a sustainable market position. As shown in Exhibit 3, this means either having a strong, clearly identifiable service profile, or committing to a competitive price advantage.
In contrast, Trader Joe’s maintains what many shoppers say are excessive prices, while others feel the prices are more than fair given the selection and quality of the product offering. Again, the firm does not capture the entire market, but a large share of the service-oriented segment.
Arrayed against this two-pronged assault, a large swath of conventional supermarkets continues to struggle. The challenge is that they not just fighting a battle on two fronts, they are fighting against two very different strategic enemies. One front is against price and the other against service. Nobody has ever won a two-front war.
Better the Devil You Know: No company has a lock on all of the best employees available. In every instance, there are stellar employees, adequate ones, and lower-performing ones. In almost every job function it is possible to identify which are which. Replacements can be made in extreme situations and work-arounds are possible if replacement employees cannot be found. The one glaring exception to this rule is the salesforce.
No firm will put up with genuinely poor sales performance, but many will subconsciously allow mediocre performance. There are two key reasons for this. First, despite improvements in technology to track sales potential by territory, the results are still somewhat ambiguous. The second is that when compensation is heavily based on commission, there is a feeling that somewhat lower performance is not as detrimental to the firm as it might be. In essence the salesperson bears the brunt of the sales gap.
In reality, the impact of somewhat mediocre performance, even with commissions, is dramatic, as shown in Exhibit 4. The exhibit assumes that a typical sales rep is responsible for $5.0 million in revenue with a gross margin of 25.0%. More importantly, the reps receive 8.0% of the gross margin in commissions. All other costs are 20.0% of sales producing a profit of 3.0%.
The last column looks at the performance of an 80% producer. That is sales, gross margin and commissions are all 80% of the typical performer. Sales commissions decline along with gross margin, so the rep does indeed share in the loss.
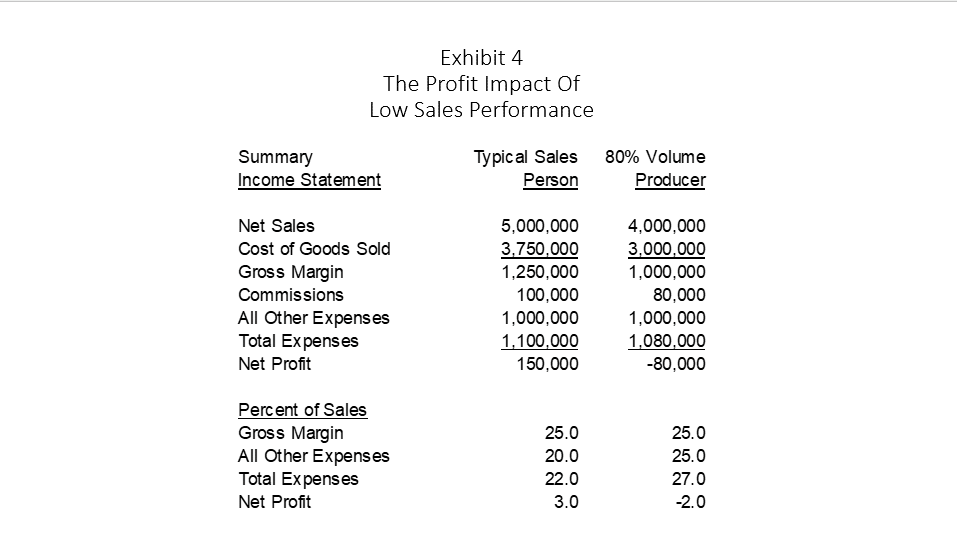
Even given the situation shown in the exhibit, firms are loath to eliminate poor sales performers. Indeed, before resorting to elimination, they should train the salesforce, motivate the salesforce, and change compensation systems if necessary. Elimination should be a last resort. Often it is a non-resort.
The barrier to action is that the costs of replacing a salesperson are well defined. The firm has to find a qualifies candidate, train that individual and then go through a period of slower sales as the new hire ramps up. They are clearly understandable costs. What is often overlooked is that they also are one-time costs.
The cost of poor sales performance as shown in the exhibit is ongoing. When training, motivation and the like do not work, the only answer is replacement.
No Big Deal: Distributors’ sales and marketing efforts naturally focus on the fastest-selling items in the assortment. These items drive revenue to cover the firms base of fixed expenses, contribute heavily to rebate programs, and help drive market share.
At the same time, there is an untapped opportunity at the long tail of products in the assortment. The bottom half of the assortment in terms of the SKU count only produces around 5.0% of total sales. Given their small contribution to revenue, they are easy to forget.
As incongruous as it may seem, these items actually represent an important opportunity to increase the firm’s overall gross margin. Of even greater importance, the improvement is relatively easy to achieve; keeping mind that nothing is completely easy.
Exhibit 5 outlines the impact that price changes on these items can have on the total firm’s gross margin. Unfortunately, the exhibit is more than a little tedious.
Specifically, the exhibit looks at a velocity code mix of A items though D items. On the left side of the exhibit, the A items are the fastest selling by far (50.0% of total sales), but carry the lowest gross margin percentage. They are highly competitive as customers buy them frequently. The word commodity comes to mind.
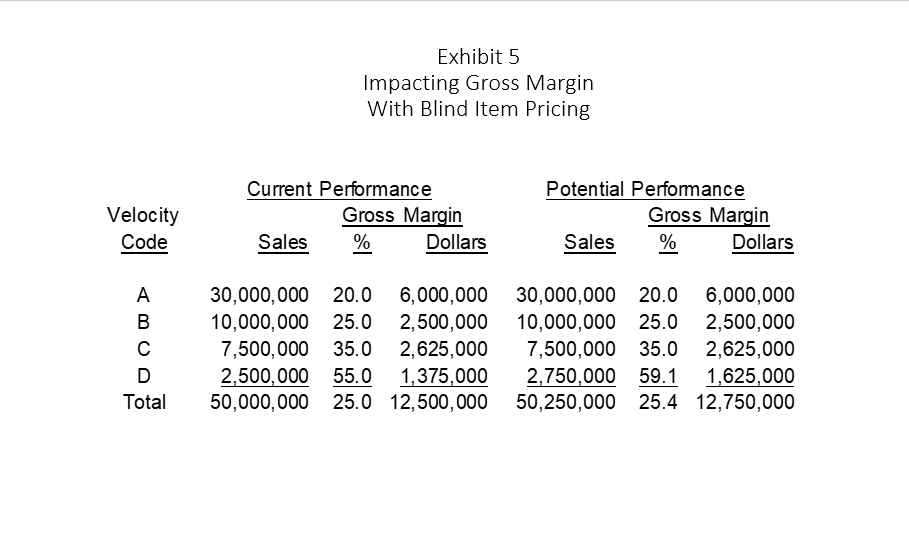
D items typically are ones that are bought infrequently. They also tend to be lower-priced items. Of greatest significance, they often are only bought when needed. Availability is not a value added, it is a major gigantic one.
Moving from the left side of the exhibit switches from current performance to potential results. In the exhibit the A through C items are left exactly where they are. The key is that the D items have their prices increased by 10.0% on the right side of the exhibit. This not only raises their gross margin percentage, but increases the total firm’s margin by .4%
In practice, many in the firm may feel that the gross margin on the D items is already too high. There is a concern that customers will feel they are being gouged. Given the purchase pattern of these items, the most likely response from customer is a sigh of relief that the item is available.
If firms are still unsure if they can raise prices, they should try a test. Find ten or so D items and raise them by say 10.0% and see what happens. Most likely customers will be appreciative that the item is in stock.
Moving Forward
With each of the four barriers, there are specific actions that are required. These involve top management, the marketing/merchandising segment, sales management, and the pricing officials. Four is a lot to address.
Luckily, none of the barriers requires a massive change in activities. With small improvements, large financial rewards are possible.
Dr. Albert Bates is Principal of the Distribution Performance Project, a research and education entity focusing on distribution. He makes about 100 presentations each year on topics such as Improving the Bottom Line, Doing More with Less and Pricing for Profit. He also heads the firm’s investigation into profitability research for over 50 different trade associations. He has published widely in both the professional and trade press, including in the Harvard Business Review and the California Management Review. He has also authored eight books on financial planning for businesses.
