Wholesale distribution is a unique business structure unlike its sister sector retail and almost 180 degrees opposite product manufacturers whose goods they distribute. Distribution’s capital structure creates unique challenges requiring specific solutions often not found in the general study of business management.
Wholesalers don’t have the capex expenditures found in retail where constant display changes and new, upscale locations are needed to improve customer sales. Distributor warehouses don’t have to appeal to consumer traffic for revenue increases. And, unlike manufacturers, distributors don’t have a significant amount of fixed costs in plant, property, and equipment. While some distributors offer light manufacturing, they most often augment existing products and hence have limited need of expensive machinery found in core manufacturing.
Wholesalers, however, do have significant operating costs tied up in repeat business serving professional customers who resell or install their products into a larger application. Distributor customers often have relationships going back decades; they have a high level of trust and dependency on their distributor to make their businesses successful.
Customer costs and the field of customer profitability came into the forefront when activity costing and activity management gained widespread acceptance in the industry.1 The subject of customer profitability management is perennial in the distribution sector. Its interest is fueled by a simple reality. There are significant service costs incurred by different customers and, to manage the customer investment, activity allocations help to manage operating cost investment in the customer portfolio.
Activity costing and customer profitability ride waves of popularity and decline. We count two distinct waves since the introduction of the knowledge base. The first in the mid ‘90s to the early aughts and the second from the early teens to around 2015. As market conditions change and customers consolidate and change, we forecast a third wave for Account Profitability to emerge in the next few years. Customer consolidation, especially, makes engaging an Account Portfolio exercise prescient.2
Many distributors are approaching customer investment the same way they served markets two decades ago. We’ll show why this can be a disastrous move and can destroy earnings even as sales grow.
Cumulative Profits of the Customer Portfolio
Traditional customer profitability work has concentrated on the individual account. However, most distributor account bases, in the past decade, have not increased in number commensurate with sales increases. This is largely due to customer consolidation. In short, the large customers have become extra-large while the number of medium and large customers has fallen. Distributor sales are often top-heavy with large and extra-large accounts.
Extra-large accounts are demanding. They often bid out their products annually and have unique support requirements. Vending machines, on-site tool cribs, account-specific personnel, custom software capabilities and special financial arrangements are all part of these relationships. These accounts, if not managed carefully at the operating profit level, can negatively impact profitability. This is exacerbated by the historic sales culture of distributors.
Wholesale distribution has a strong tradition of selling. Sales territories are allocated by geography and sellers paid bonuses in margin dollars or incremental margin dollars. The compensation and nature of selling means that the attention to managing the operating contribution of the customer is, mostly, zilch. It is this imbalance, especially as customers consolidate, that brings financial misery to the wholesale firm.
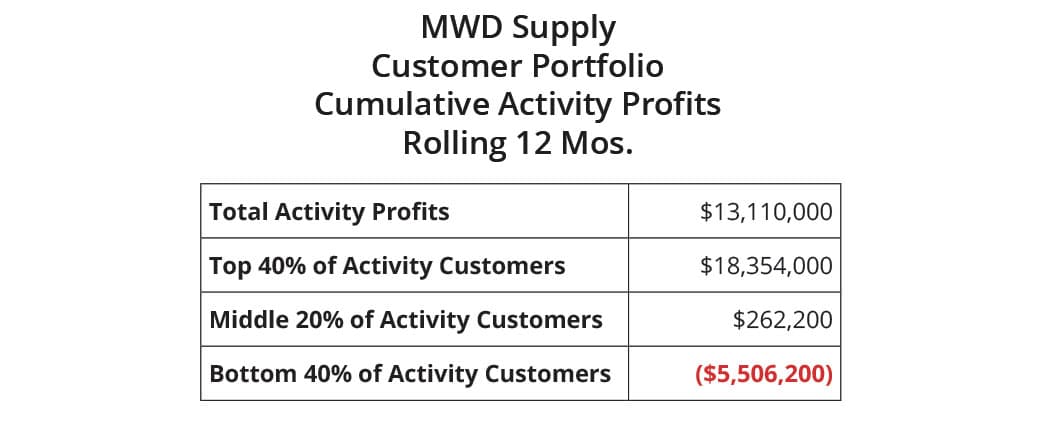
More worrisome is that many distribution execs don’t know the causality for sluggish or declining earnings despite sales growth. We give an illustration of this in Exhibit I where we refer to the mock distributor MWD Supply of Minneapolis, Minn. MWD serves industrial and fastener markets of the Upper-Midwest. For the most recent year, sales were $375 million, Gross Margins $93.75 million, Operating Expenses were $79.5 million and Operating Income $14.25 million or approximately 3.8% of sales. On the surface, MWD is a solid, but not spectacular performer in their vertical markets.
In Exhibit I, we’ve developed a Cumulative Activity Profit review of the Account Portfolio. In the exhibit, the total activity profits are slightly less than the firm’s operating income of $14.25 million. This is the result of income-generating activities as identified in the activity model and is consistent with practice as not all income is generated by customer activity.

What is uncommon is that many distributors don’t look at the cumulative activity income as provided by the entire account base. The analysis for cumulative activity profits by account is straightforward. Activity profits by customer are ranked from highest to lowest and a cumulative field (column) of percentage of total activity profits is added. Our result, consistent over years of activity profit determinations for wholesalers finds:
- 40% of accounts are 130% to 140% of total activity profits.
- 20% of accounts break even and generate negligible to slightly negative activity profits.
- And 40% of accounts destroy 30% to 40% of activity profits.
Distribution has an aggressive step-cost structure; operating expenses rise with sales volume. Even seemingly fixed costs such as warehouses and material handling equipment rise with volume more so than other business types.
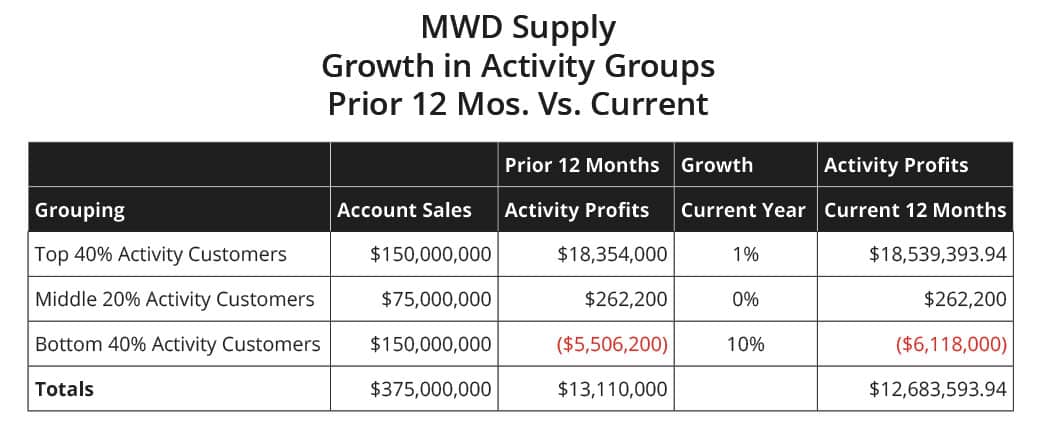
The risk in distribution sales management is what happens when the firm inordinately grows the accounts which destroy profitability? To answer this, and for simplicity, we assign each group a sales value equal to their percentage of activity profits. In short, 40% of activity profits is $150 million ($375 million x 0.4) for both positive- and negative-activity producing accounts. Neutral-profit accounts are $75 million in sales. In Exhibit II, we’ve modeled the growth of negative-activity accounts at 10% and positive-activity accounts at 1% with no growth for neutral accounts. From the exhibit, we find the following:
- Activity profits for the top-activity customers increase approximately $200,000 with a 1% sales growth.
- Activity profits for the bottom-activity customers decrease activity profits $610,000 with a 10% sales growth.
- Total activity profits, with the growth in negative-activity accounts, decrease $420,000 from the prior 12 months.
We often get pushback from distributors who doubt the growth disparity between activity-positive and activity-negative accounts. However, our work in activity profitability, in the past decade especially, finds that customer-base consolidation has created large or extra-large accounts who are often activity negative. They conduct business with a one-sided mindset including: annual renegotiation of contracts largely based on product price, demand for free services, specialized software and reporting, service guarantees including penalties if service standards are not met, multiple changes during the contract year that are often unprofitable for the distributor, etc.

Unless distributor management reviews their cumulative activity profits, they won’t know that growth in negative-activity customers is sapping operating profit, despite overall sales growth. To conduct an analysis that is sound with solutions that have impact, we will cover these topics in the next article.
For now, consider that it is increasingly common and probable, in today’s wholesale environment, to grow sales and reduce operating profits.
1 Our work and experience with Activity Costing and Management finds that an industry-wide acceptance and need for the discipline originated in the mid-1990’s and following the consulting work of Arthur Andersen for the wholesale sector.
2 Sherman, Business Consolidation Is Crushing The Economy And People (forbes.com), Forbes Online, August 2019,
Scott Benfield is a consultant for B2B Manufacturers and Distributors. He is the author of six books and numerous research projects on B2B channels. He can be reached at benfield.scott@aol.com or (630) 640-5605.


