Distribution Strategy Group conducted an electronic survey with Modern Distribution Management in September 2016 of 425 participants to better understand trends in distribution marketing.
Summary
- Marketing initiative performance
- Distributor marketing lags as only 4% of respondents are high performers in marketing compared to 18% out of distribution
- Vehicles and channels
- Digital marketing (email, search marketing, and social media) usage has increased significantly since 2011
- People and in-store (display merchandising, branch events, trade shows, telemarketing) have decreased significantly except for telesales
- Mass media (radio, TV, outdoor media) have increased significantly as a percentage, but still remain small overall
- Print marketing (catalogs and flyers) have remained about the same from 2011 to 2016
Distributor Marketing Lags
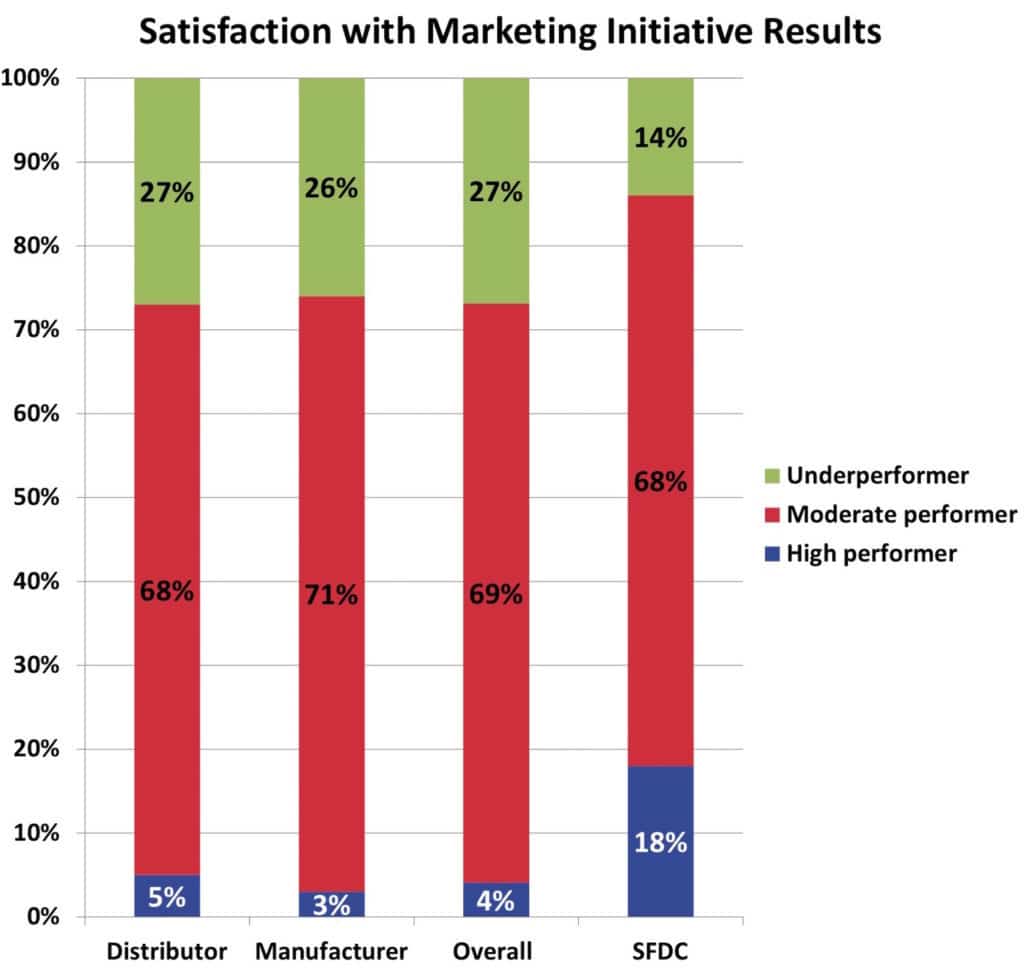
- Other sectors as shown in SFDC survey have a much greater percentage of high performers.
- Distributors have an enormous opportunity to gain competitive advantage through development of a high performing marketing.
B2B Digital Marketing Impact
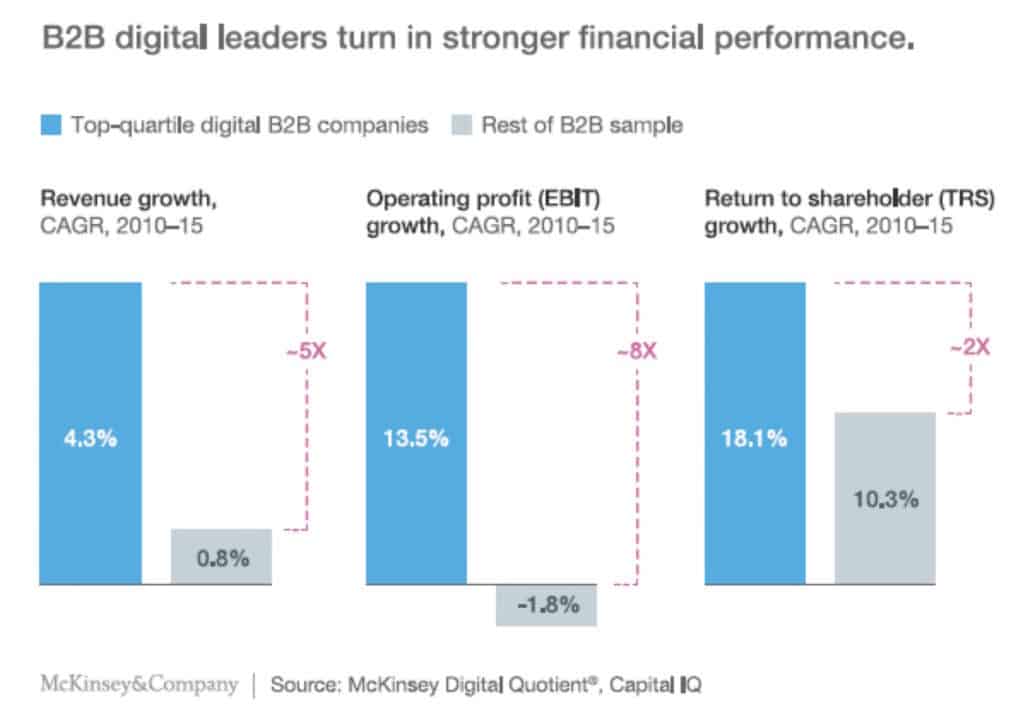
- Digital marketing leaders have much stronger revenue growth, EBIT growth, and return to shareholders than companies without strong digital marketing.
- This parallels results from the 2016 Distributor Marketing Survey.
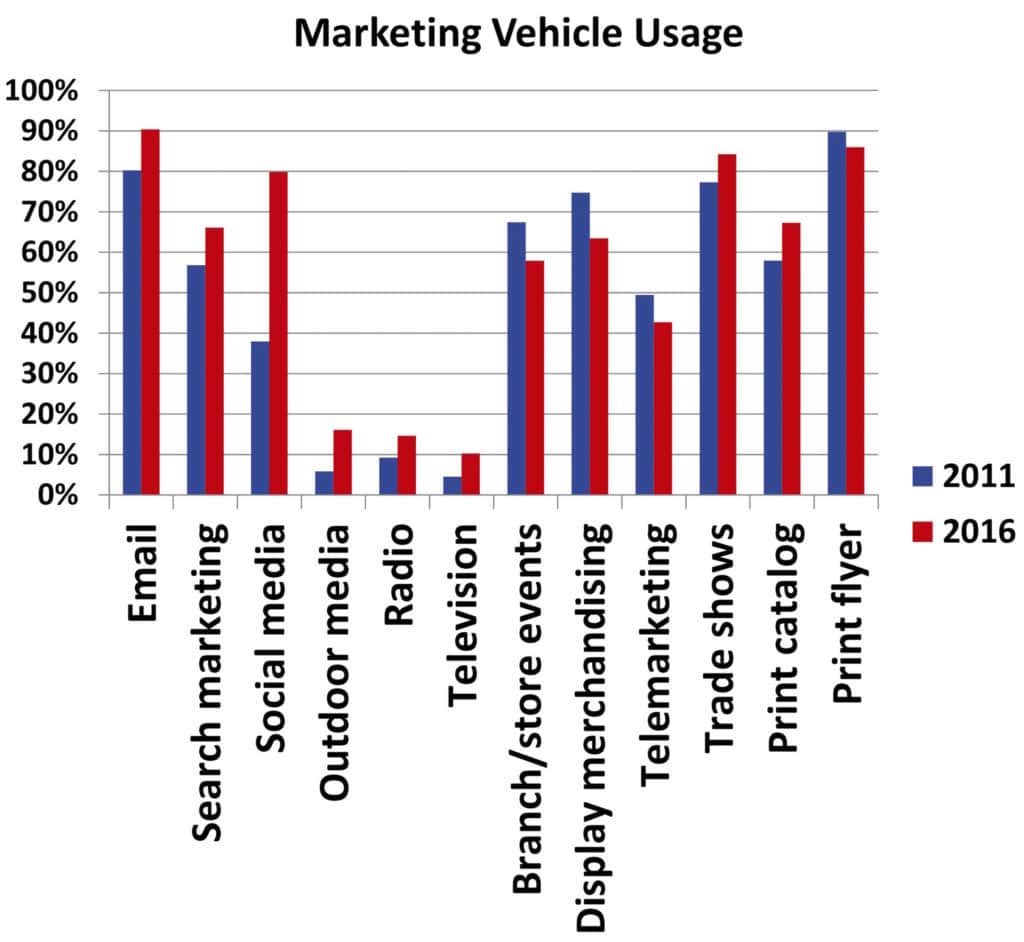
- Significant increase in digital marketing
- Moderate decrease in person to person/in store except trade shows
- Increase in print catalog
- Significant increase in mass media
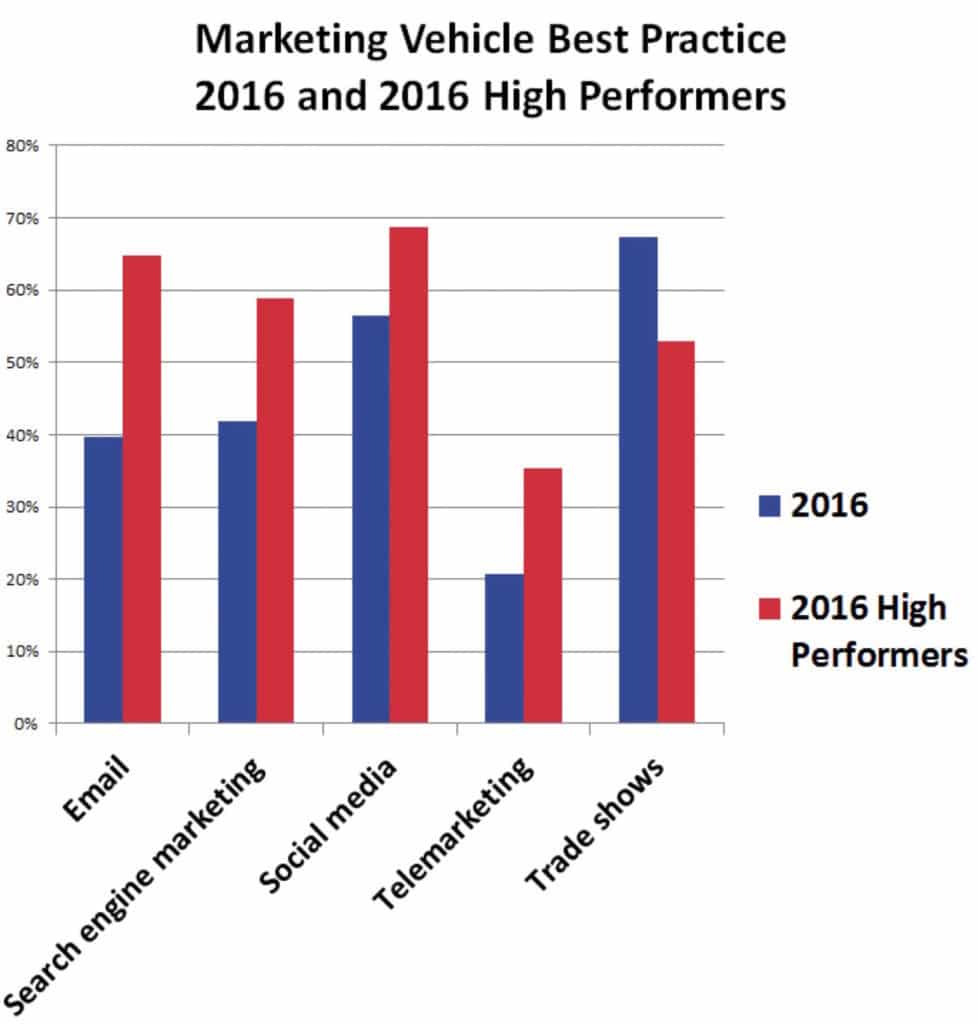
Big differences between high performers and the rest of the respondents:
- Much greater percentage of high performers do email, search marketing, and social media at least weekly
- High performers are much more likely to do telemarketing
- The rest of the respondents are more likely to do annual or quarterly trade shows
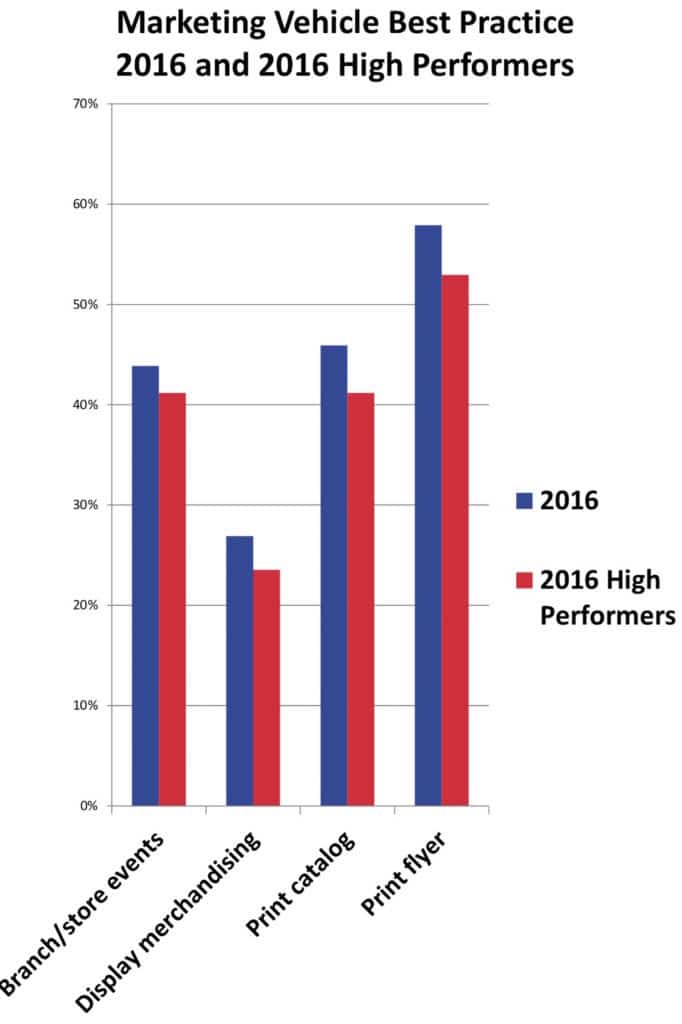
Print remains popular among all respondents, however a smaller portion are doing flyers annually or quarterly.
Display merchandising has decreased significantly since 2011 with minimal differences in high performers vs. the rest of the population.
Branch/store events have declined in usage since 2011 with minimal difference between high performers and the rest of the population.
Survey Respondents
Respondent Annual Revenue
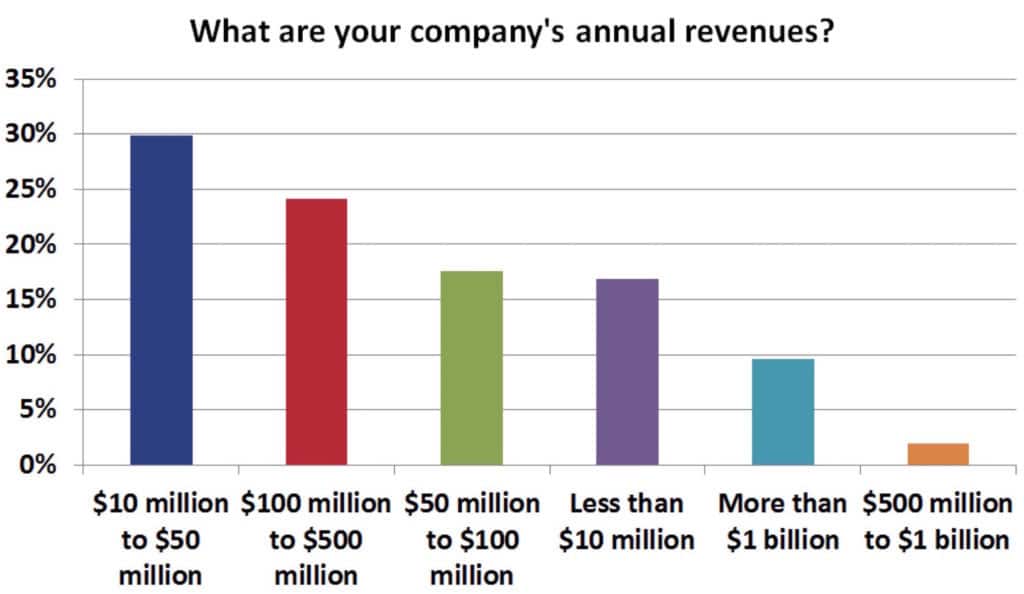
- Nearly 50 percent of respondents were small distributors with less than $50 million revenue.
- Over 40 percent of respondents had $50 million to $500 million in revenue.
- The remainder were large with more than $500 million revenue.
Company Description
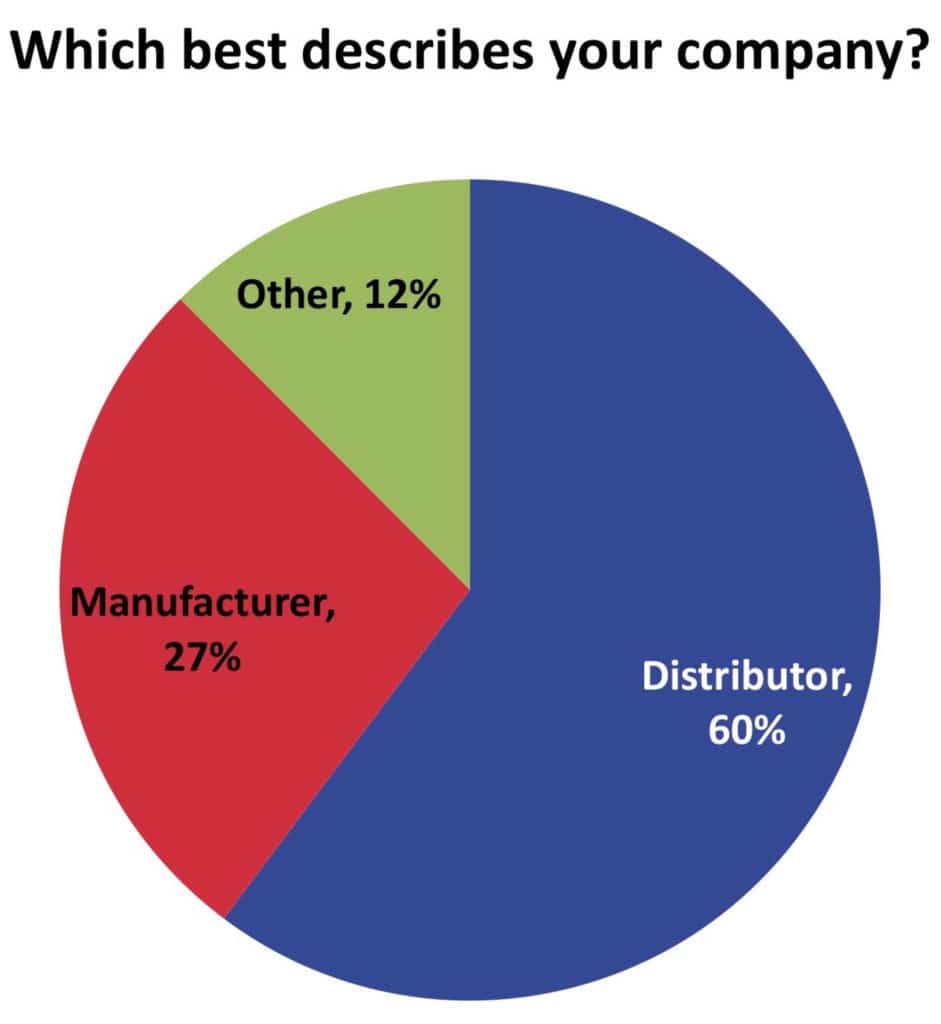
- 60% distributor
- 27% manufacturer
- Others included:
- Buying group
- Association
- Manufacturer’s rep
Respondent Business Sectors
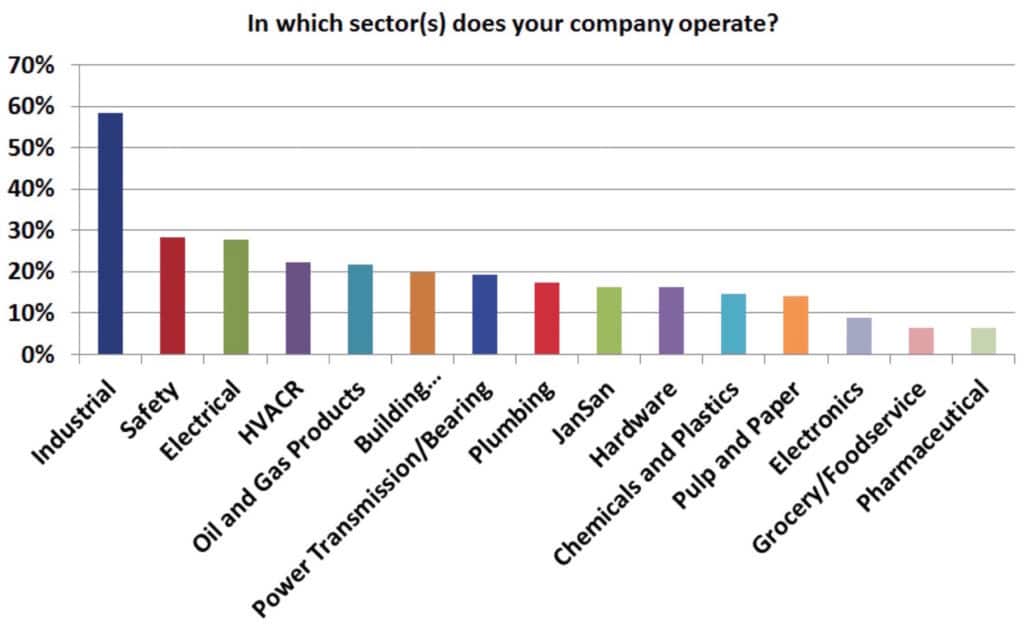
- About 60% industrial
- 28% are safety or electrical
- Over 20% are HVACR/plumbing, oil and gas
Branches/Stores
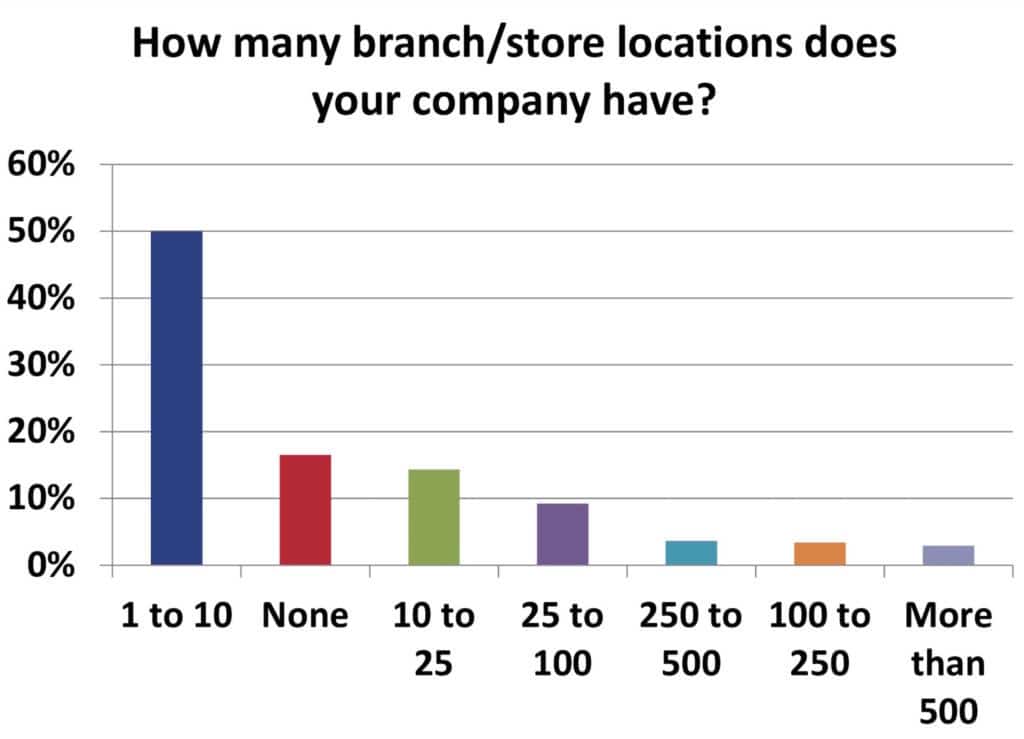
- 16% have no store
- Half have 10 or fewer stores
- 14% have 10 to 25 stores
- 9% have 25 to 100 stores
Respondents by Job Function
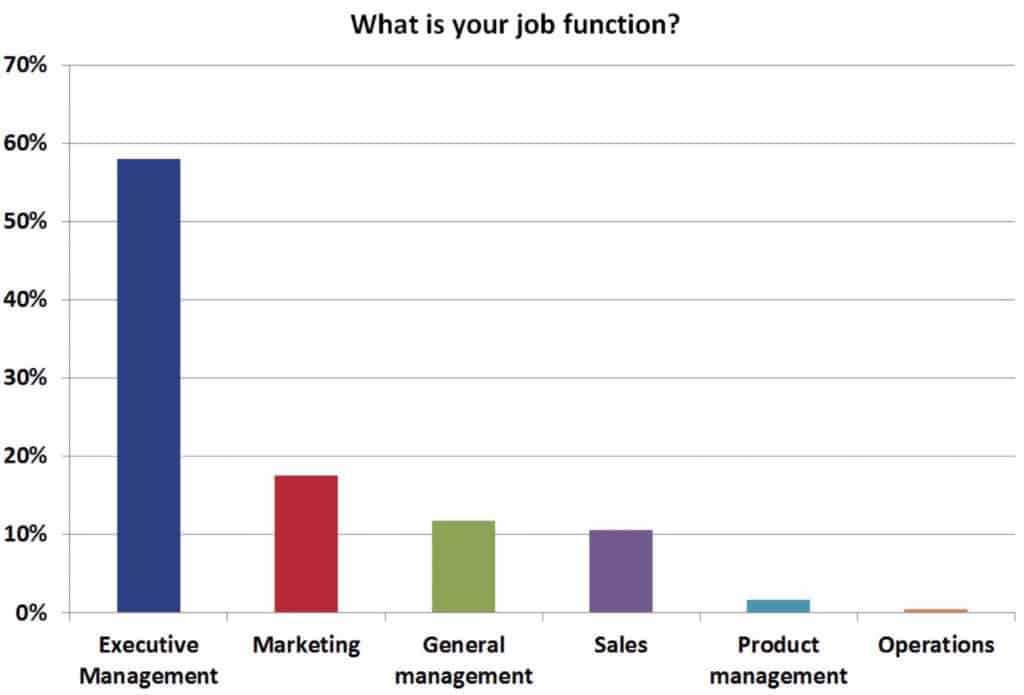
- 58% executive management
- 18% marketing
- 10% sales
- 11% general management
Jonathan Bein, Ph.D. is Managing Partner at Distribution Strategy Group. He’s
developed customer-facing analytics approaches for customer segmentation,
customer lifecycle management, positioning and messaging, pricing and channel strategy for distributors that want to align their sales and marketing resources with how their customers want to shop and buy. If you’re ready to drive real ROI, reach out to Jonathan today at
jbein@distributionstrategy.com.

